What we’ve learned at the Energy Data Hackdays 2022 – and what’s next?
- Media
We can’t believe how fast time has passed since the 4th Energy Data Hackdays 2022! It’s been half a year and we’re already getting ready for the next round from 15 – 16 September at the FHNW in Brugg-Windisch. But before we tell you to save the date – how about some inspiration delivered by the past?
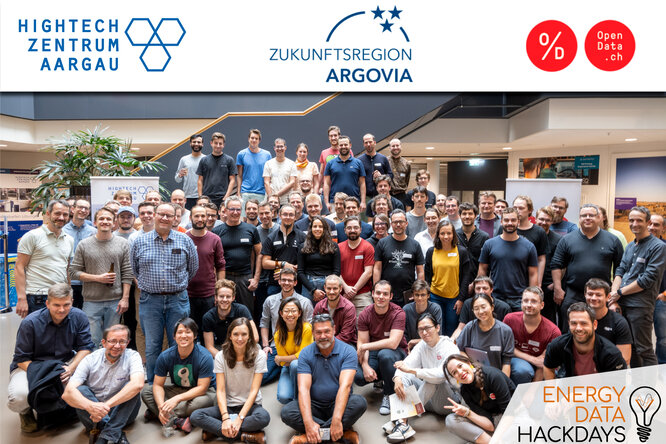
The EDH22, as we call them, took place from 16 to 17 September at the Hightech Zentrum Aargau and was a mammoth ecosystem effort between over 31 Organisations, among them yours truly Opendata.ch and of course the Hightech Zentrum Aargau (which was also the main sponsor, alongside AEW).
We welcomed over 110 participants and guests on Friday 16th at the Hightech Zentrum Aargau and saw them join 13 teams over the course of the morning. They worked really hard for the next 32 hours in order to be able to present their work and team effort during the final presentation!
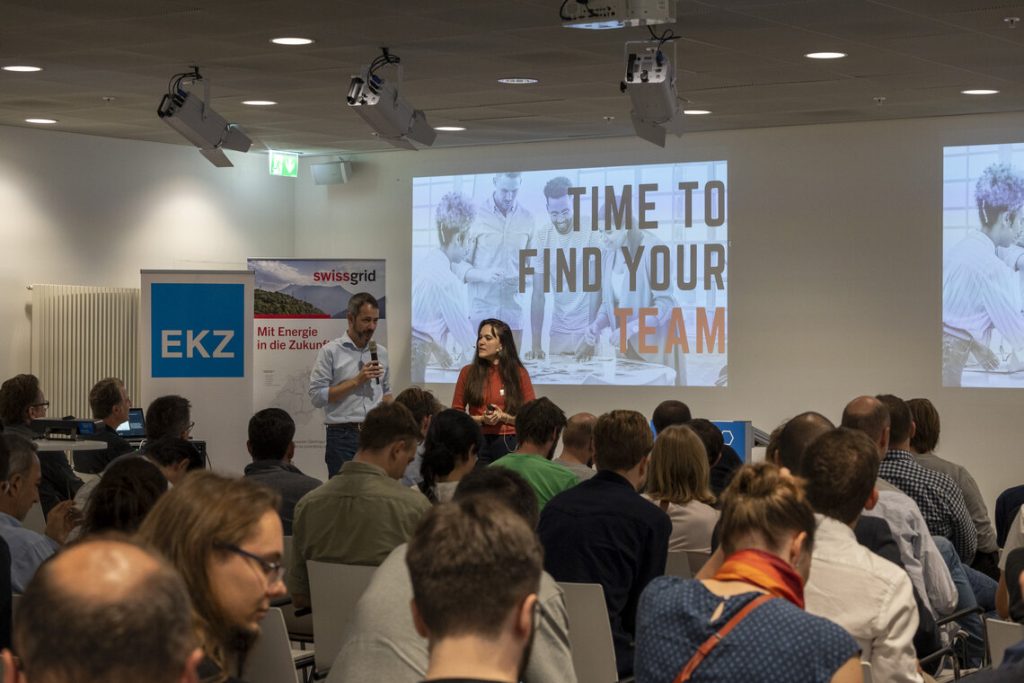
Challenges, Projects & Pitches!
A challenge when it comes to challenges is to keep everybody’s attention, during 17 pitches, up. But this was an easy task, mainly sponsored by the high quality of the pitches that covered (hot) topics from “Energy Heat Demand Modelling” to more philosophically artsy projects such as the “EMF Walk through Brugg”.
Without further ado let’s dive into the projects:
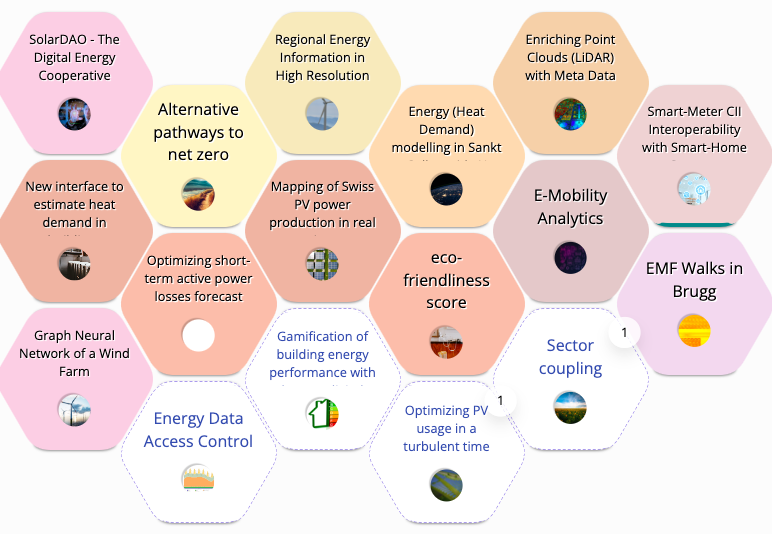
SolarDAO
SolarDAO is no newcomer to hackathons, as they had already participated in the Open Legal Lab 2022. We hope to see them again! SolarDAO’s goal is The DAO is to help energy cooperatives to become bigger, more powerful and more organized as the digital energy cooperative.
New Interface to Estimate Heat Demand
Heating is the biggest consumer of energy in Swiss homes and is still 60% coming from fossil fuels. This needs to change very quickly to meet climate targets and end fossil fuel dependence. Knowing the heat demand of a building is the first step towards improving efficiency and changing heating systems. The Tessa Group was looking for ways to visualize, select and explore these buildings and their energy needs by developing a new concept for how a user could interact with our heat demand estimation API.
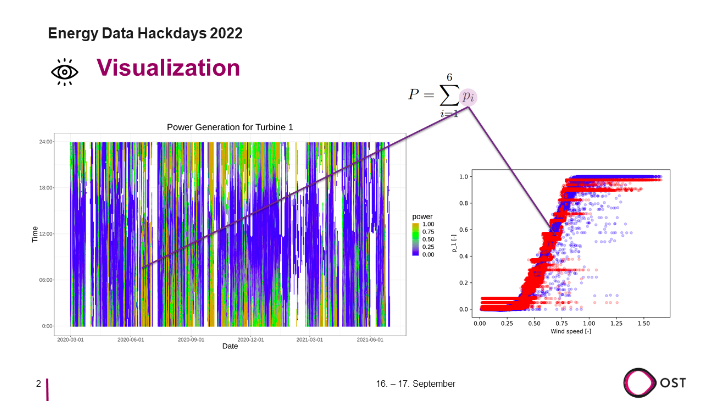
Graph Neural Network of a Wind Farm
The problem is clear: wind turbines influence each other due to their wakes. Here the goal was to create a data-driven model that can answer the following questions: what is the power output for each turbine considering wake interaction and which turbine has the largest contribution? Complex calculations and colourful visualisations followed in the hopes to allow wind farm operators to make specific changes to certain turbines in order to optimize power production.
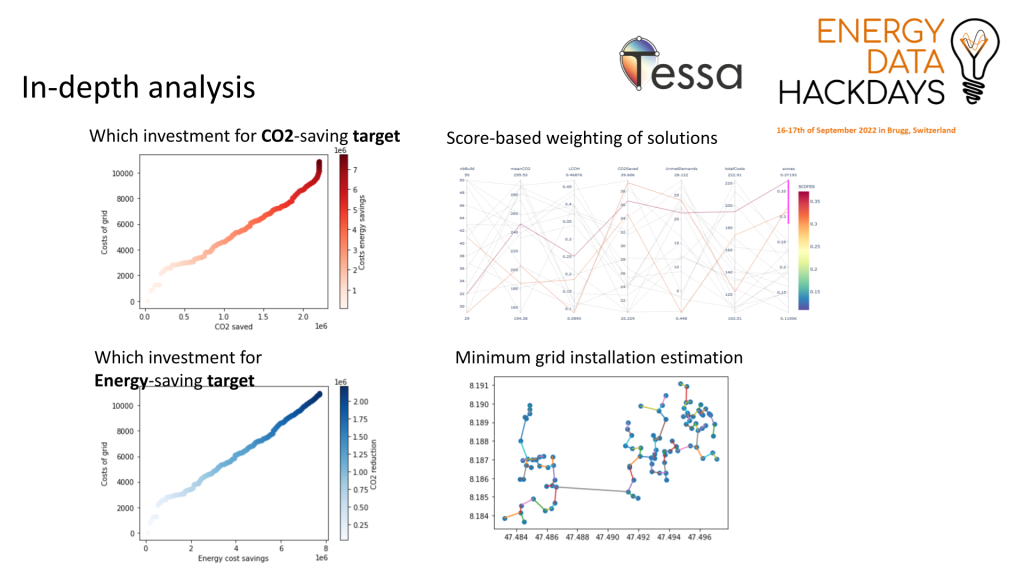
Alternative Pathways to Net Zero
ETHZ and Energy Science Center had one question at the centre of their challenge: How can policymakers make decisions based on model-driven energy scenarios? This leads to one goal: A decision-making tool to explore and compare multiple energy scenarios! They created a working prototype which they committed to continue using as part of SFOE projects.
Optimizing Short-term Active Power Losses Forecast
Swissgrid’s challenge attracted one of the larger groups with 9 team members in total. Here the goal is to create a model that reduces the risk for the system, since forecasting thermal losses due to line resistance, losses must be compensated, energy is procured according to loss predictions (day-ahead market) and finally – Swissgrid uses different models for loss prediction. They managed to create a new optimized method while also noting that existing baseline models outperformed ML-based models.
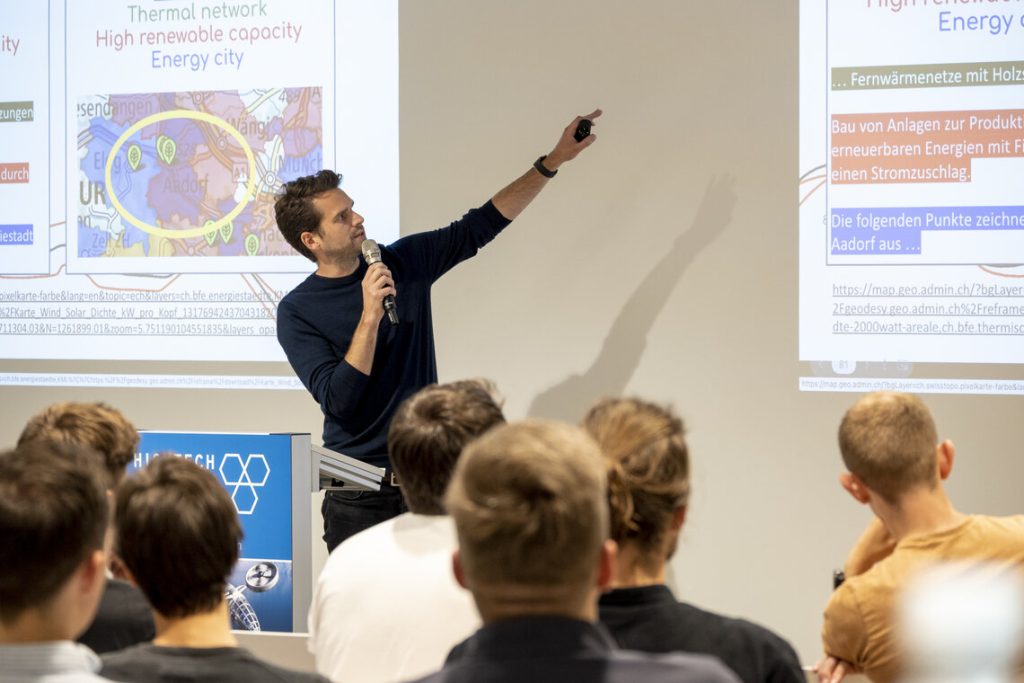
Regional Energy Information in High Resolution
This project stemmed from the Energy Data Working Group and was prepared with attention to detail and lots of communication ahead of time. Their policy context and challenges were outlined as:
- Energy policy goals are known on a national level
- Less clear energy goals on the municipality level
- Which municipalities have set energy policy goals?
- What are activities in municipalities to reach goals?
With the efficient splitting of their large group into three sections (software, data analytics and policy), they were able to receive accurate results on Aadorf.
Mapping Swiss PV Power Production
aliunid was the only group with a working prototype by the end of the EDH22 (they had a headstart though, don’t feel pressured). They took upon the challenge to simulate and map the total PV power produced in Switzerland in real-time based on real-time data from aliunid and public datasets. They were confronted with many challenges, especially because they were trying to look at real-time data during the night (when there’s no sunlight to measure) making it virtually impossible to get valuable data. Their learnings made for a lighthearted moment during the final presentations, giving us a glimpse into the many, risks and challenges any entrepreneurial undertaking might face.
Energy (Heat Demand) Modelling in Sankt Gallen
The city of Sankt Gallen wanted to build a model to predict the heat demand of all the buildings in the city of St.Gallen and then compare the model with the existing „handmade“ model, at which they did an outstanding job by already understanding what tools worked better to accomplish their goals and outline the partnerships they envisioned to foster.
Eco-Friendliness Score
Allthisfuture proposed this challenge as the topic of energy has arrived at the centre of society. In order to be able to act and be incentivised, one needs a benchmark (score) (like a Fitbit would tell its wearer that they’re doing great!). For future flexible tariff models, an underlying metric is needed. In a decentralized, renewable energy system the customer plays an increasingly active role. For example, by using energy when renewable energy is abundantly available and by reducing one’s consumption when there is a scarcity To show customers their potential for improvement, we would like to introduce a simple score based on individual consumption patterns. This score ensures transparency and creates the basis for effective incentive measures.
Enriching Point Coulds with Meda Data
AXPO was the main partner of this challenge: In densely populated Switzerland, high-voltage overhead lines are in many cases located in the vicinity of existing buildings. To protect the population from non-ionizing radiation, this team wanted to classify all buildings near power lines using publicly available landscape models and register of buildings. Linking this data with LiDAR data helps to discover any non-conforming constructions and to identify buildings which should be specially protected from non-ionizing radiation. Quite an undertaking – endless data sources needed to be combined, the volume of buildings needed to be calculated (which required many approaches), and the data points needed to be matched with data sources – leading the way to combining the gathered data with LiDAR (but this is for the next time).
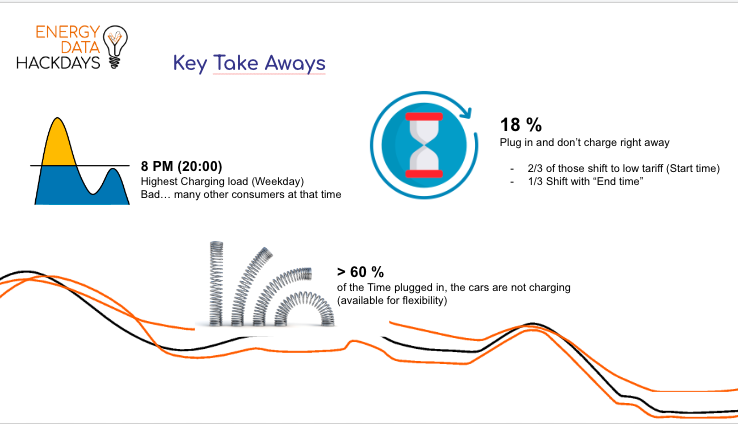
E-Mobility Analytics
Nowadays there is a lot of noise around electric mobility. As car manufacturers and the world turn towards this technology with the goal of lowering greenhouse gas emissions and as this technology gains momentum, a lot of discussions arise, bringing conflicting arguments, myths, assumptions and open questions to the surface. This we have in abundance… What we lack is real data and facts based on this data to support all these theoretical discussions – trying to bring the theoretical into the real world!
Smart-Meter CII Interoperability with Smart-Home
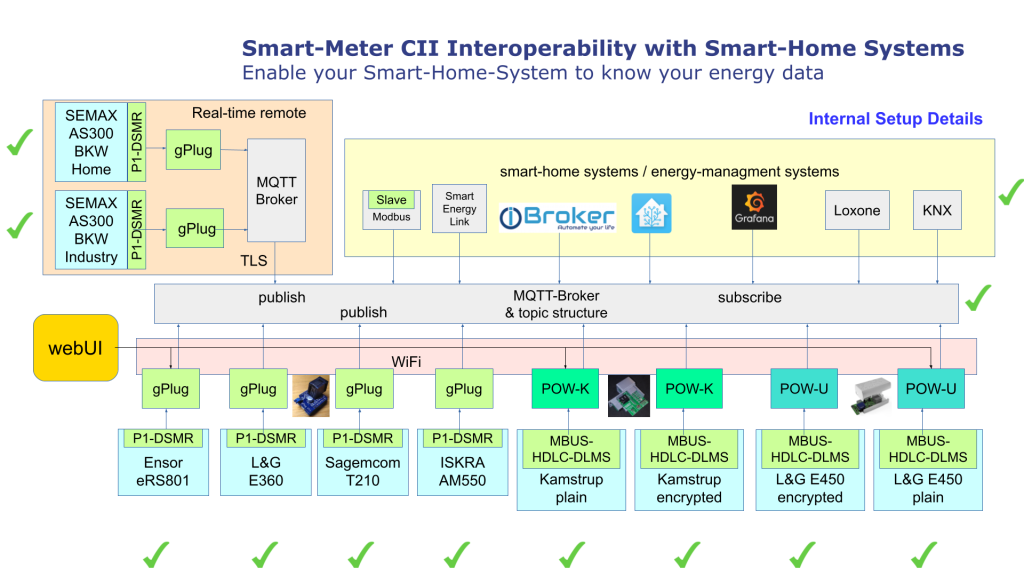
In last year’s CII -challenge, the team around Herman Hüni demonstrated how 4 Swiss DSO smart-meter (SM) deliver their energy data through their local Customer Information Interface (CII, like M-BUS or DSMR) by using specific IoT-Adapters that will publish the data towards a common interoperability layer, the MQTT-broker.
This year, they extended the range of SM to include further SM like Ensor, Kamstrup, and Sagemcom and explore others. While also deploying some new SM-powered IoT-Adapters to allow DSO-customers easy and reasonably inexpensive local access to their energy data and report on the issues encountered with MBUS-HDLC-DLMS-COSEM, DSMR and other types of CII.
In short: the team set as their goal to enable customers to know their energy consumption in real-time and reuse original smart-meter data instead of private energy counters. Many, for the unschooled eye, complex words and graphs later, the team was able to clearly identify a set of limitations, such as expensive MBUS import adapters but also their next steps (for the next Energy Data Hackday 2023?) – to establish strong standards, enhance documentation and integrate remaining large DSO’s Smart meters. We’re looking forward to it!
EMF Walks in Brugg
This project was a very spontaneous, creative and unexpected rendition of EMF (electric and magnetic fields) that can be found in the city of Brugg. Bottom line: Energy Data is everywhere! Watch the video here.
Thank you, and see you at the Energy Data Hackdays 2023!
thanks to all partners, sponsors and participants! We can’t wait to see you on September 15 to 16 at the FHNW in Brugg!