Energy Data Hackdays
- Hackathon
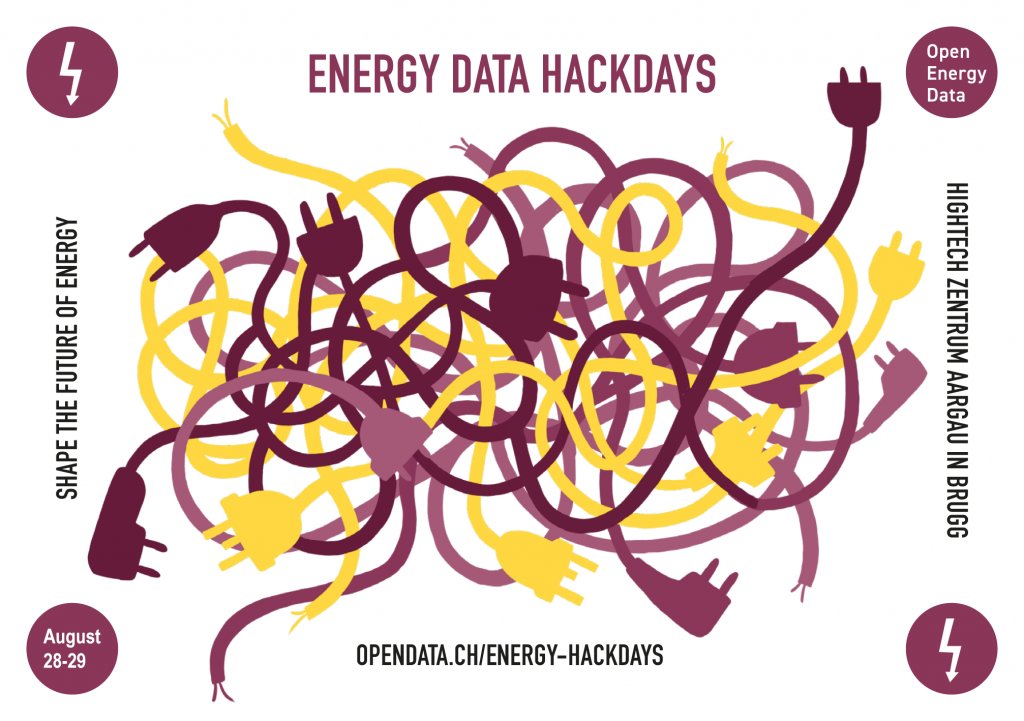
28–29 August 2020, 09:30 @ Hightech Zentrum Aargau, Badenerstrasse 13, 5200 Brugg
Organised by Opendata.ch, Hightech Zentrum Aargau AG, Zukunftsregion Argovia
The Energy Data Hackdays took place on 28 and 29 August 2020 at the Hightech Zentrum Aargau in Brugg – postponed from March because of the pandemic and held on site with a safety plan. Around 80 participants worked at the Technopark and seven more online; for 32 hours, teams developed solutions to challenges posed by utilities, universities and research institutes.
Two themes shaped this edition: predictions with machine learning – heat demand of district heating, power curves of wind turbines, anomalies in smart-meter data, failures of transformers – and the visualisation of energy data, especially from smart meters: reading data through the customer interface, new uses for households, a platform for the data of ETH’s Energy Science Center. Added to this were the cheapest charging station nearby, the charging behaviour of electric cars and Switzerland on the Electricity Map.
The challenges were presented on Friday and the results on Saturday afternoon; both were streamed live. Campus 21 filmed impressions and interviews on site.
Photos
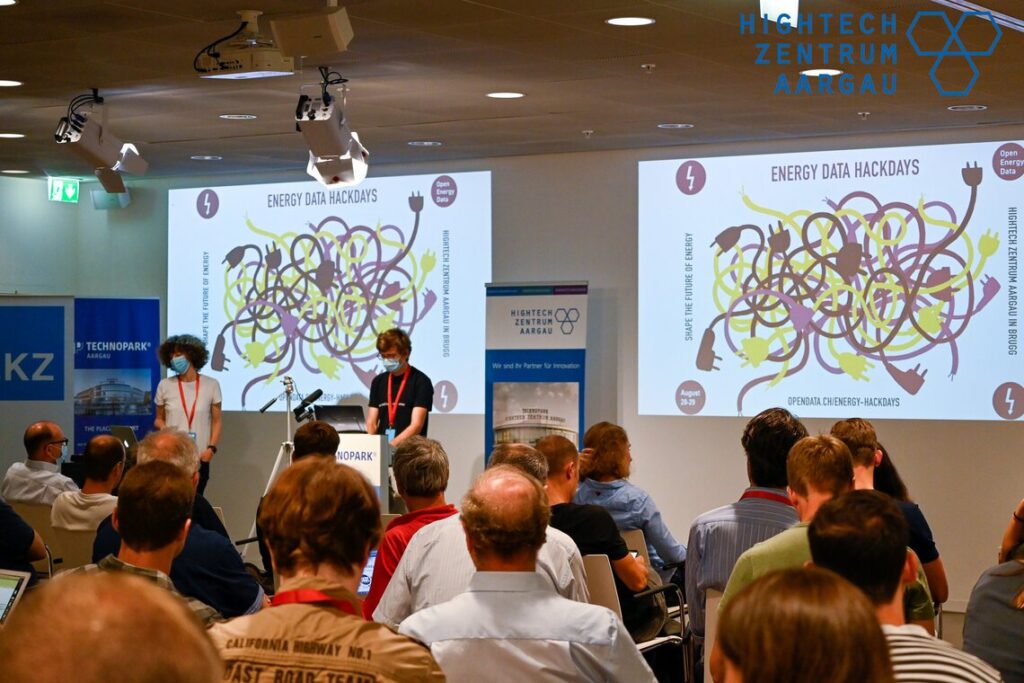
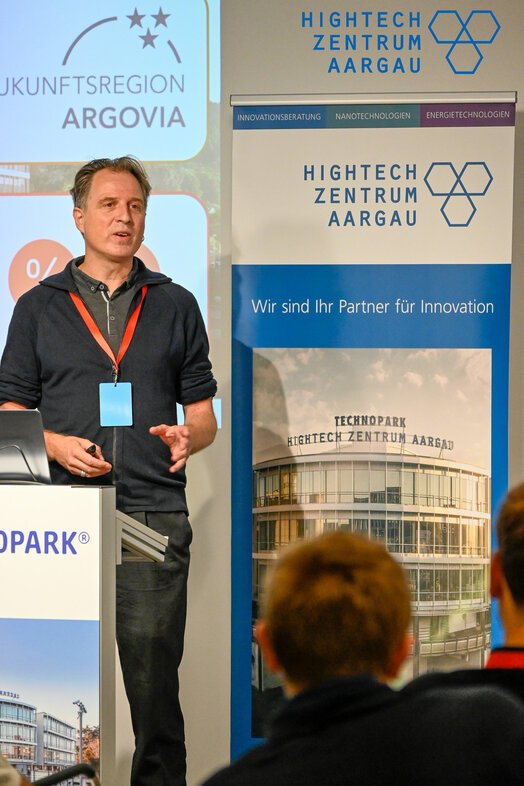
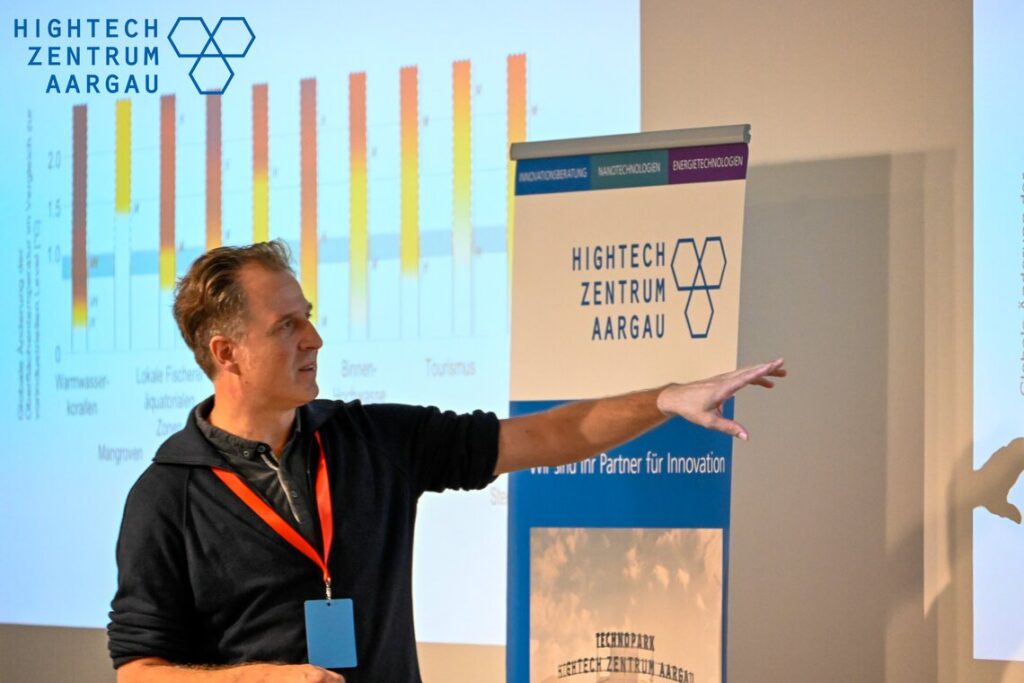
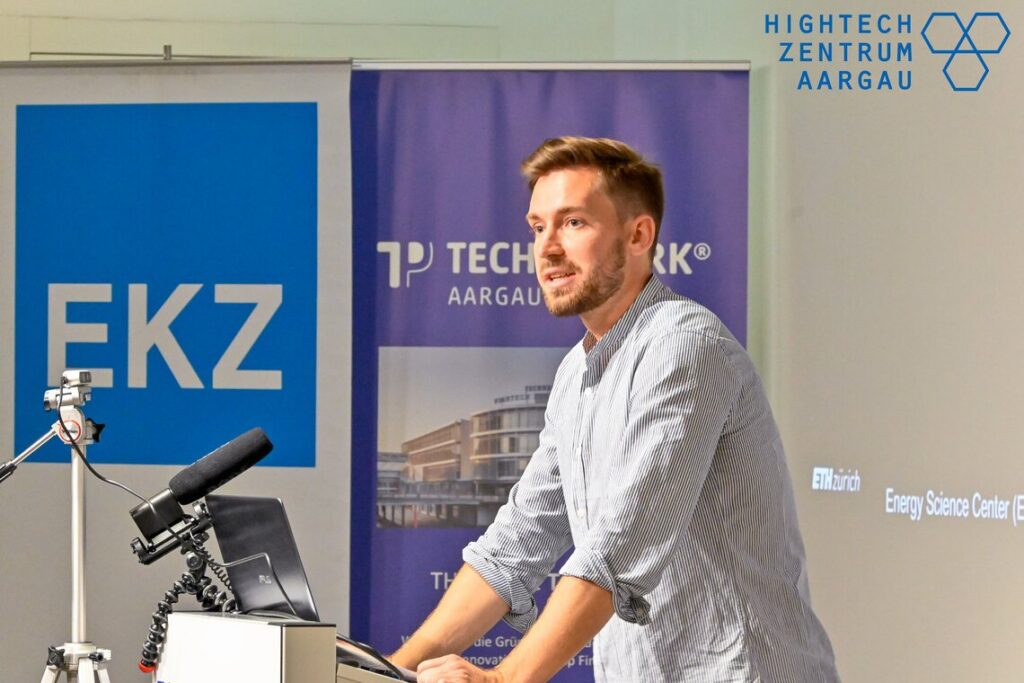
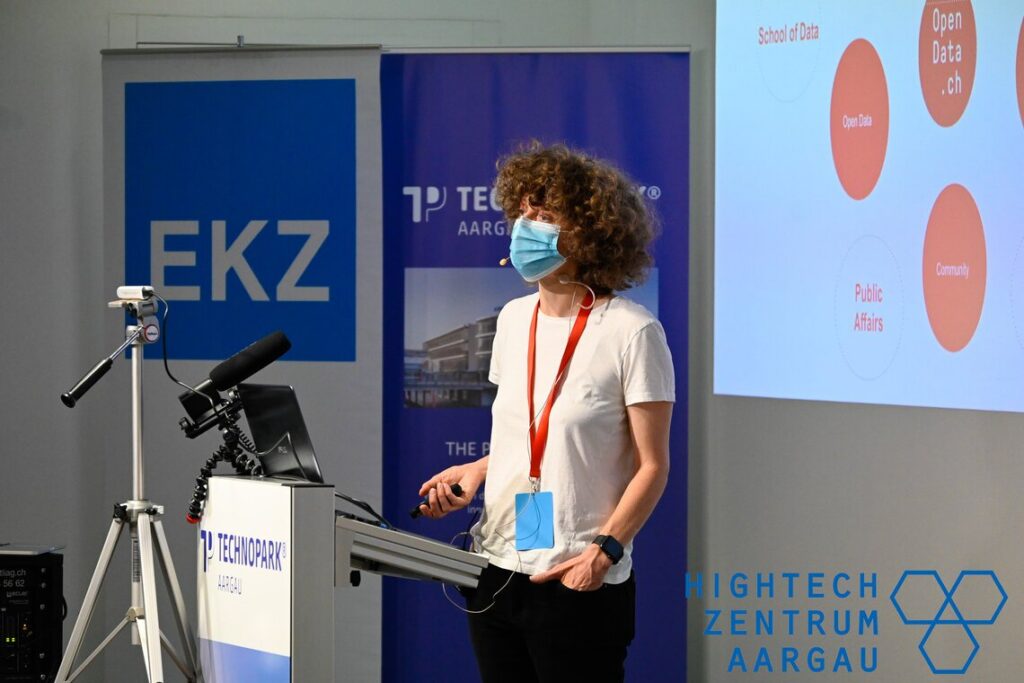
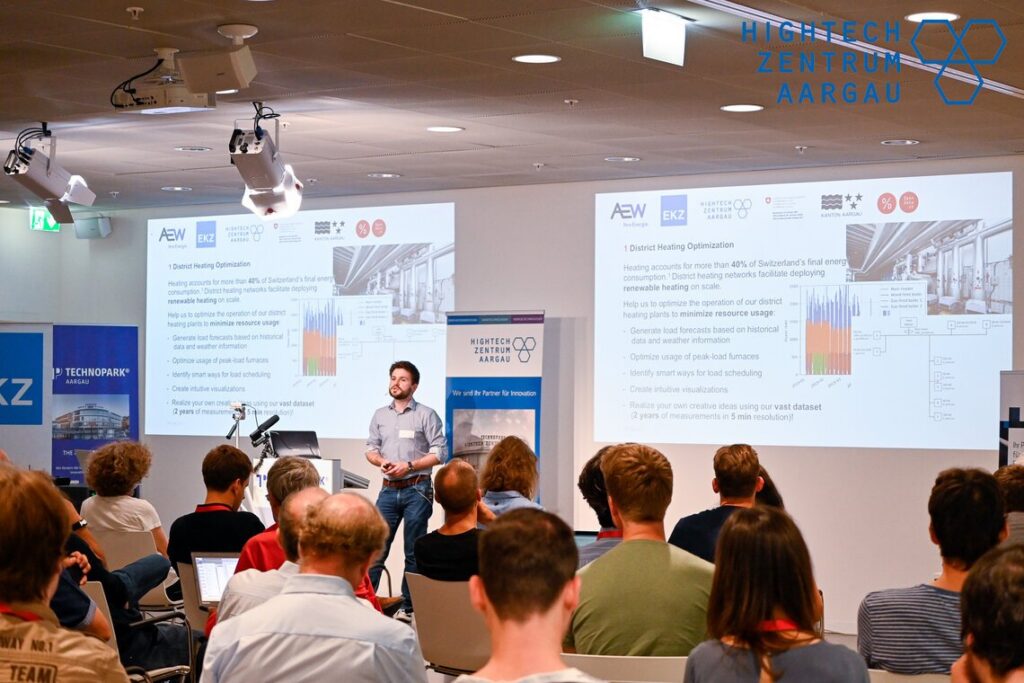
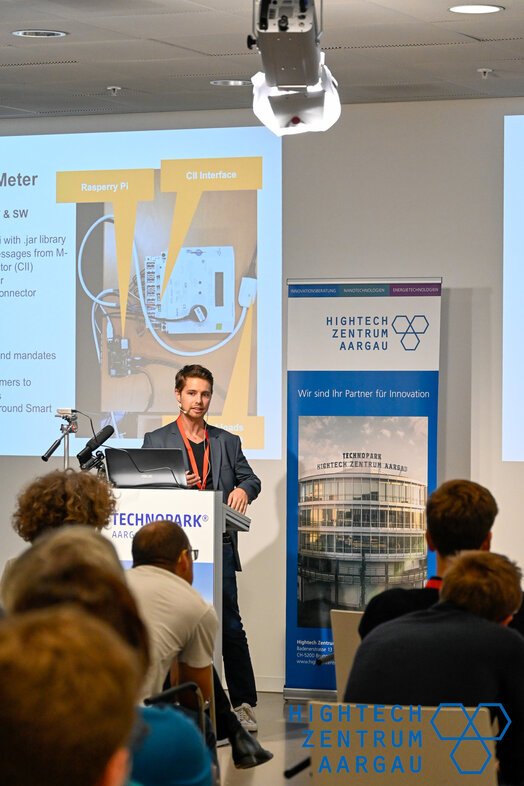
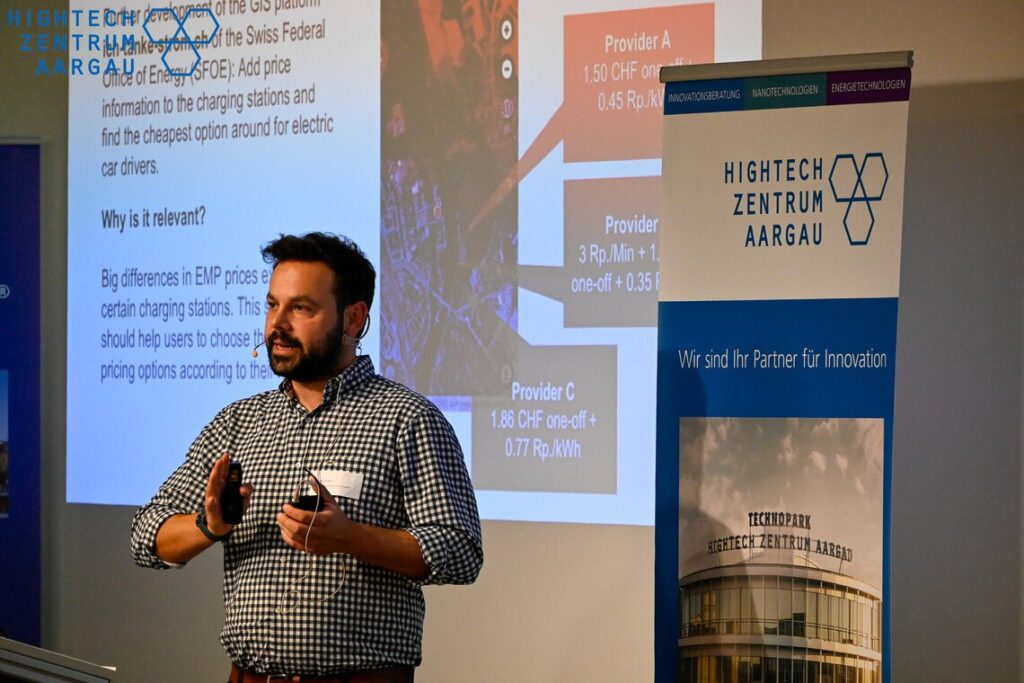
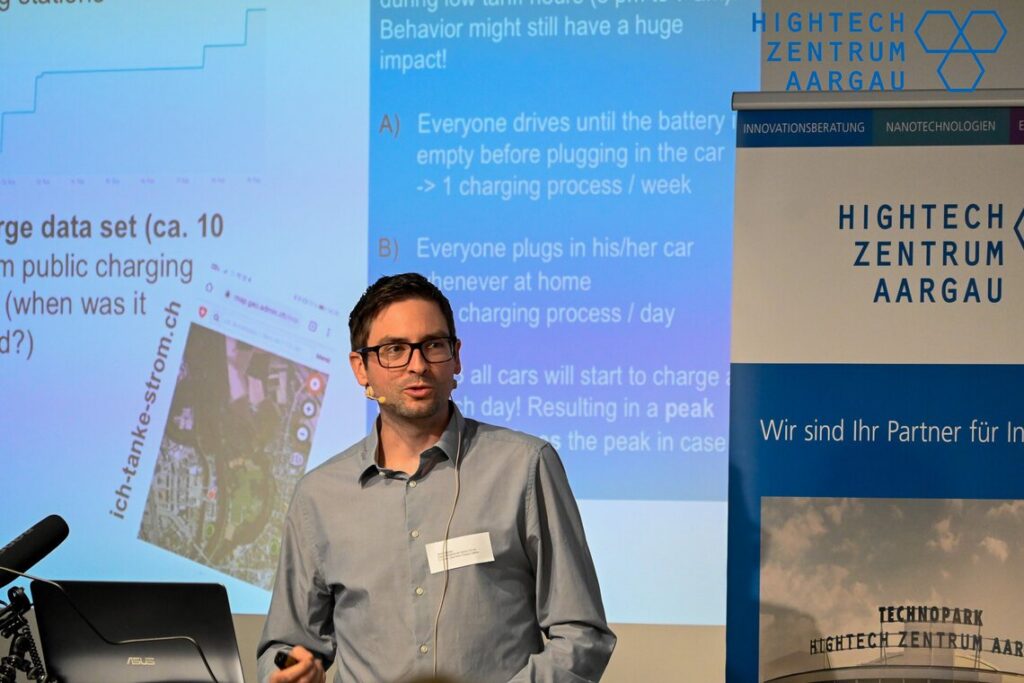
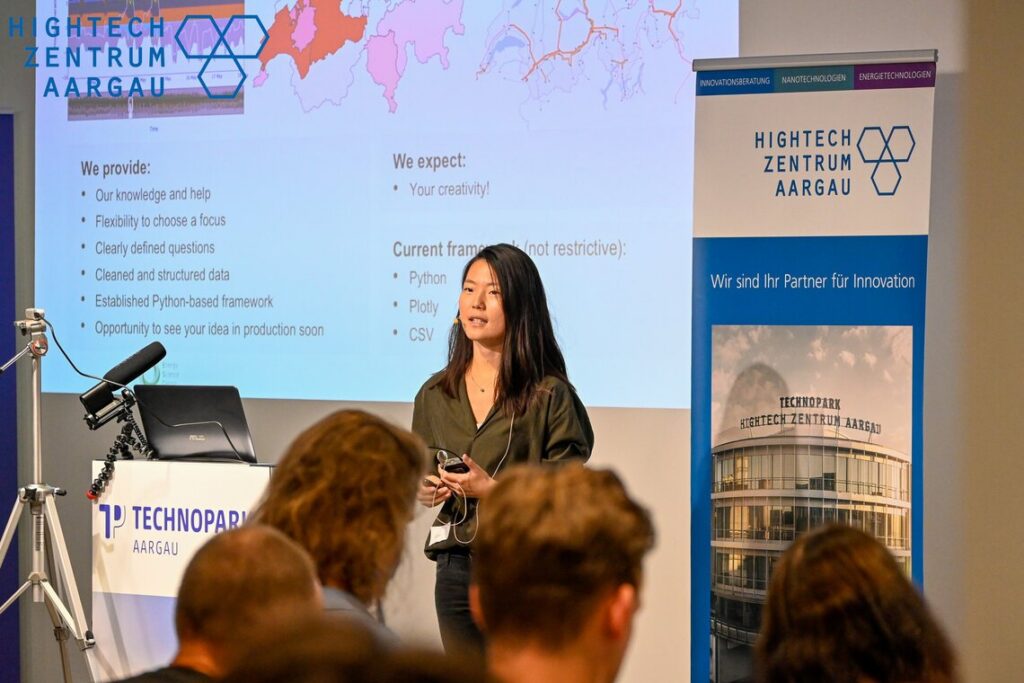
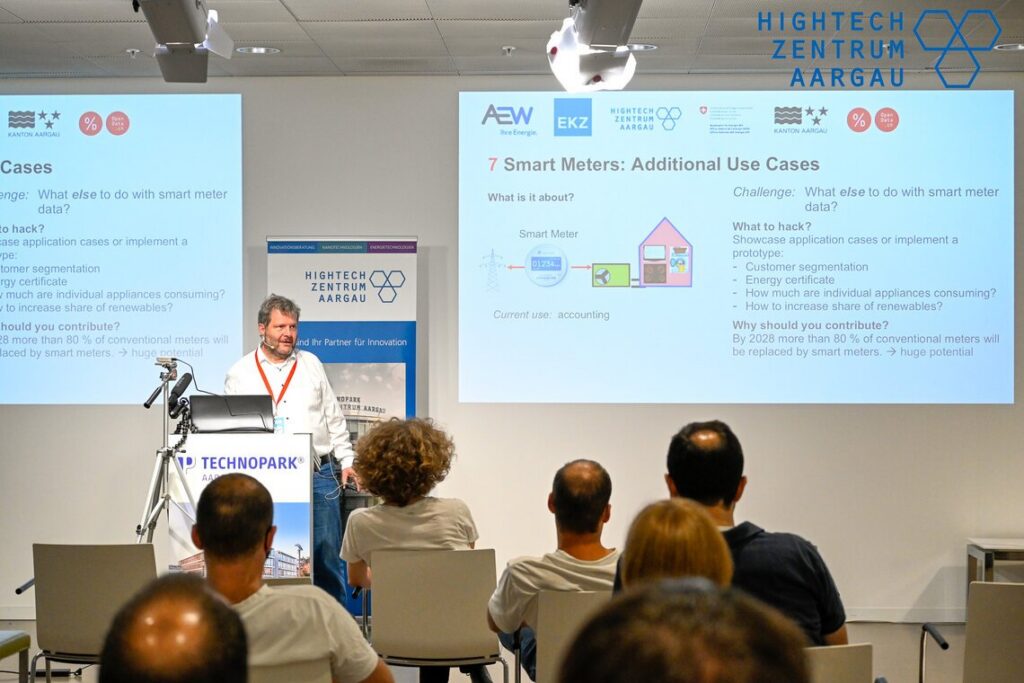
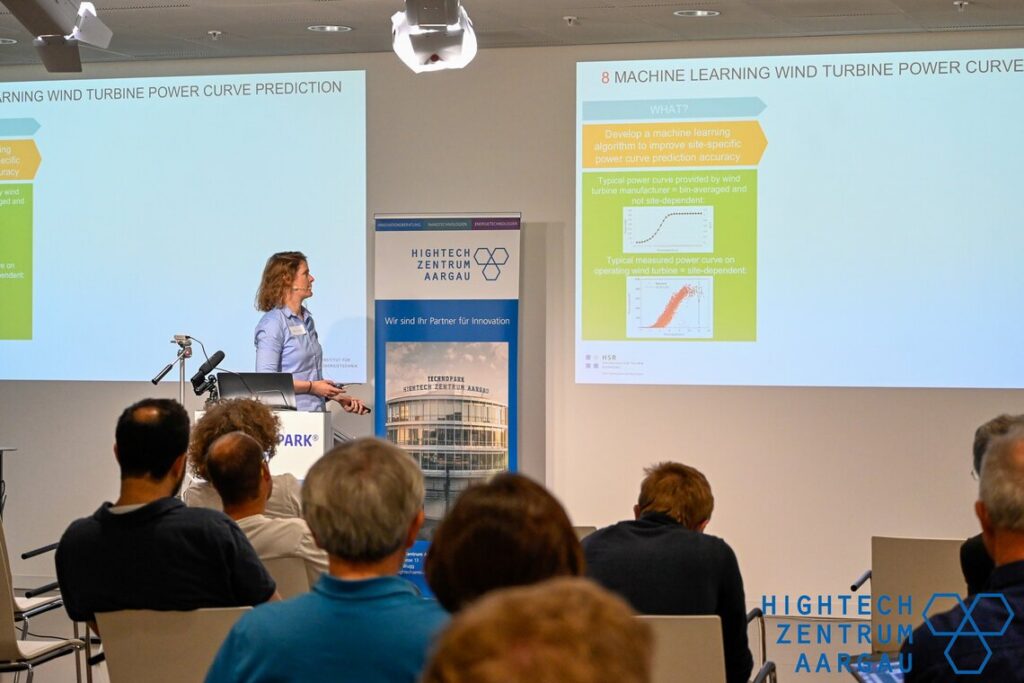
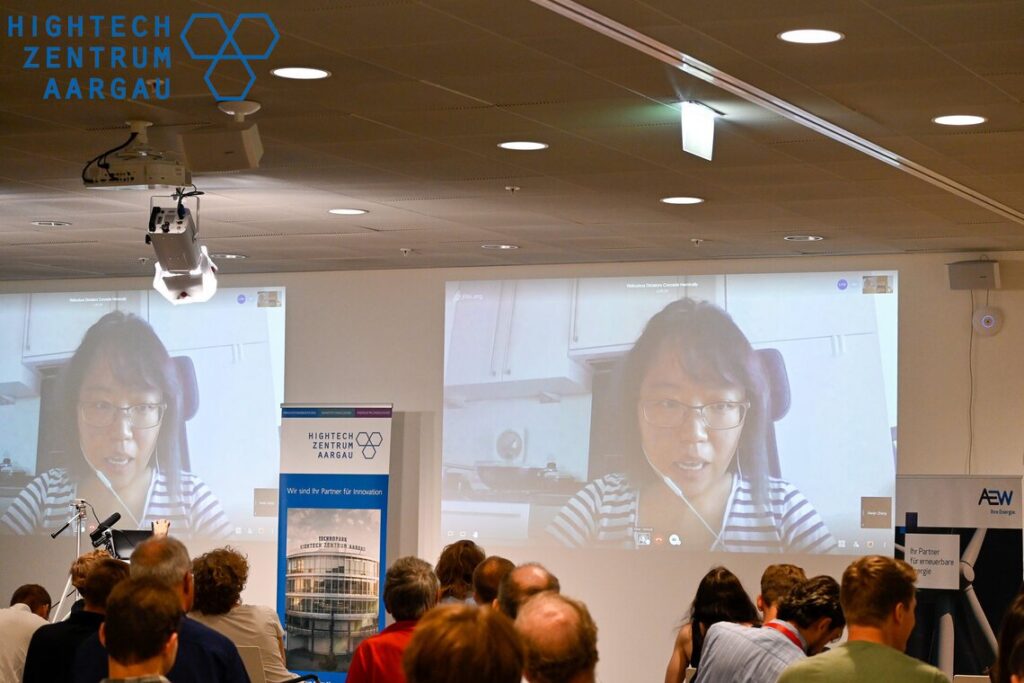
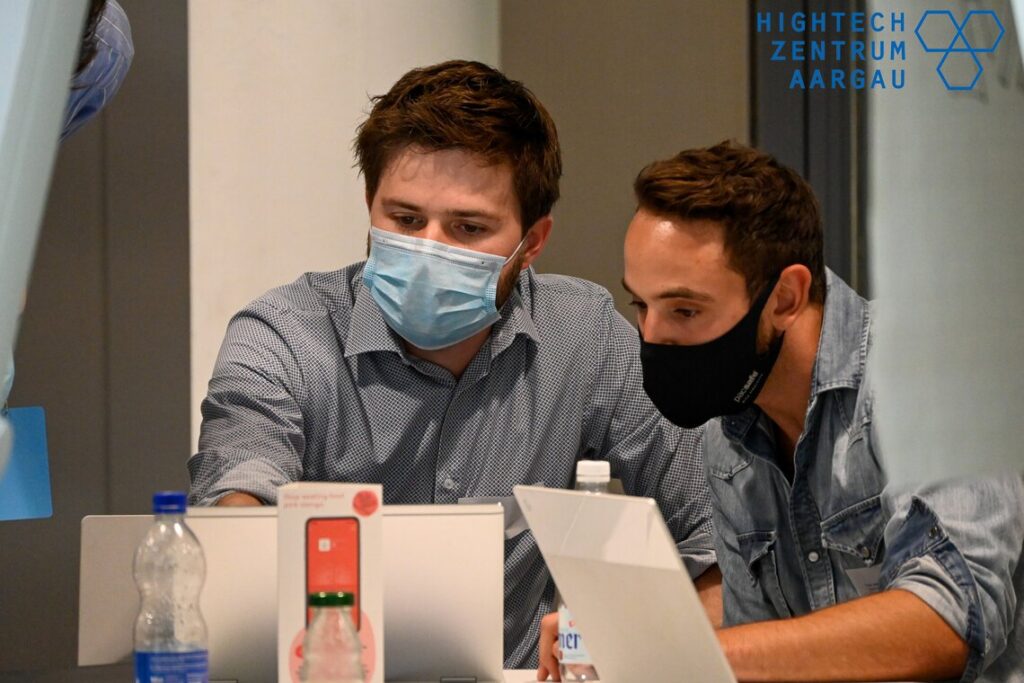
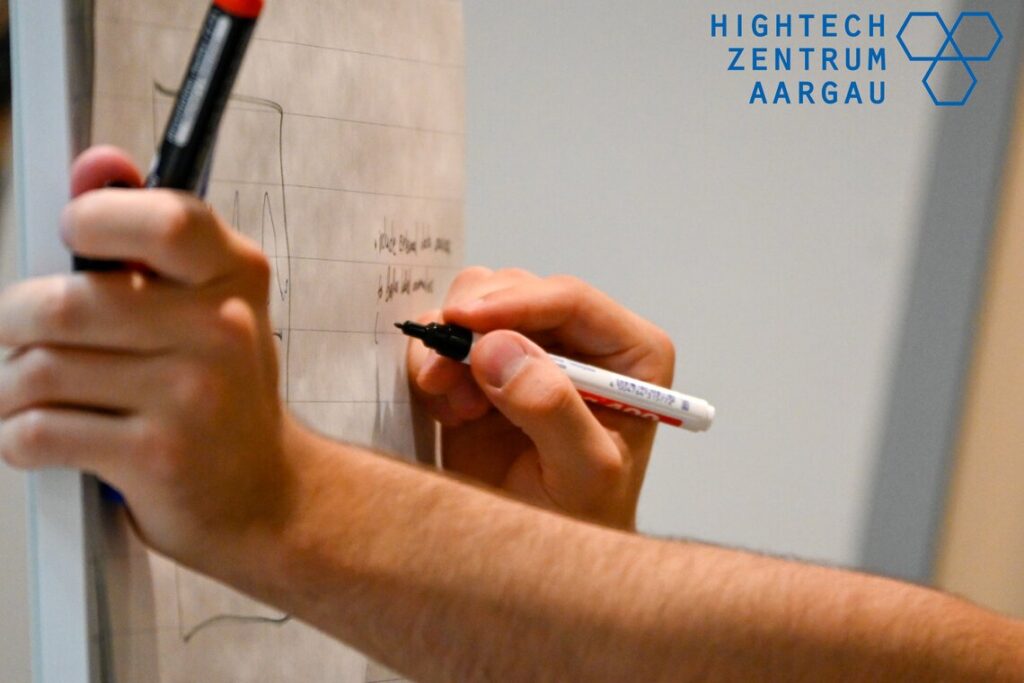
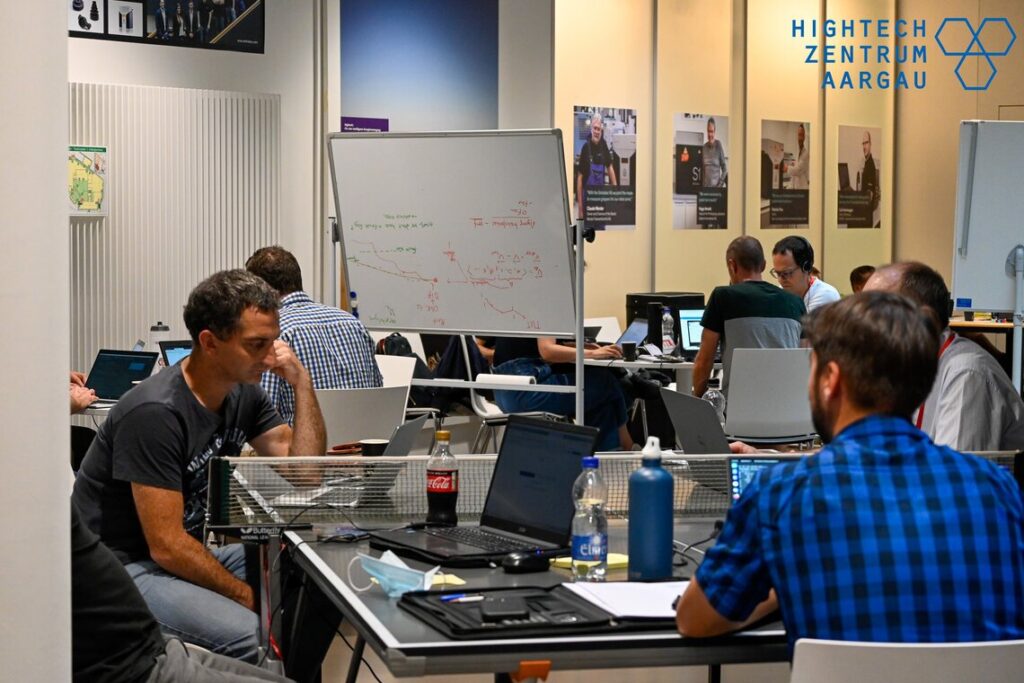
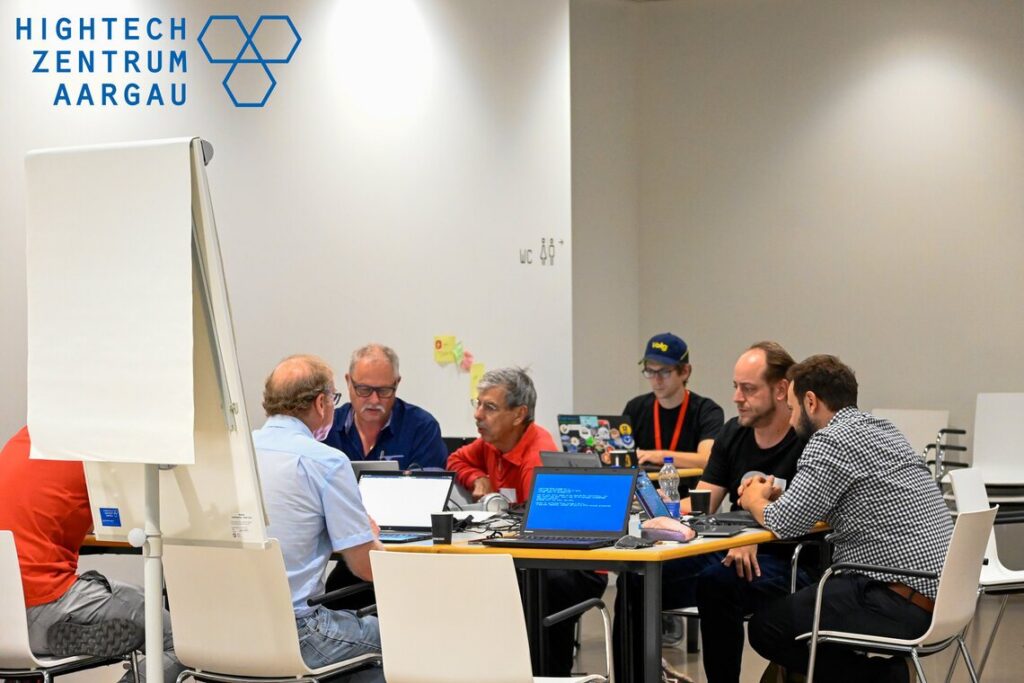
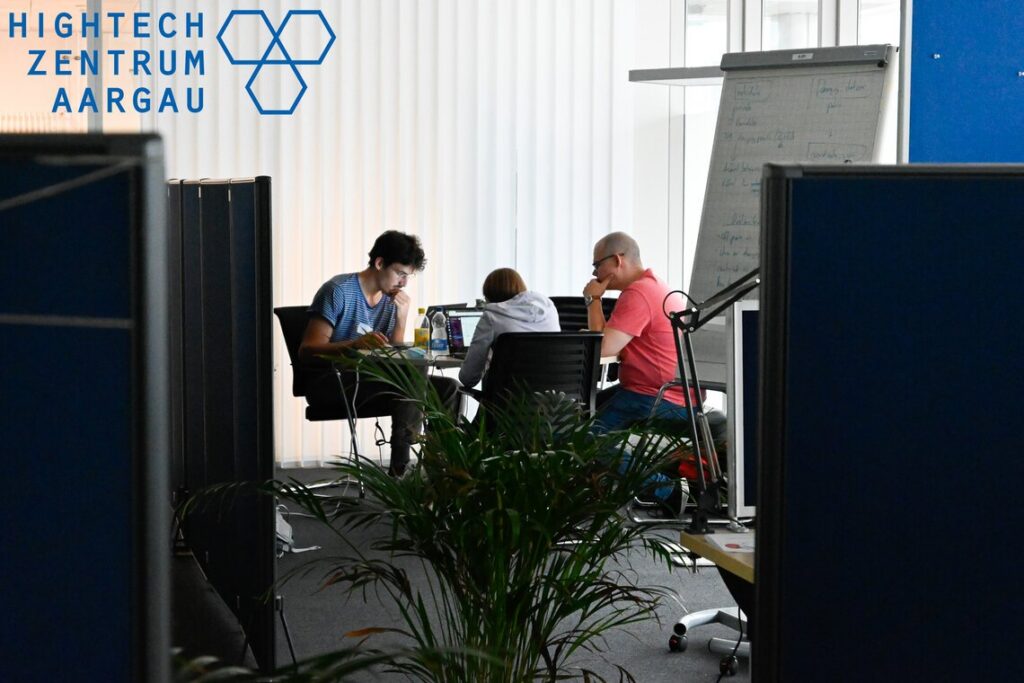
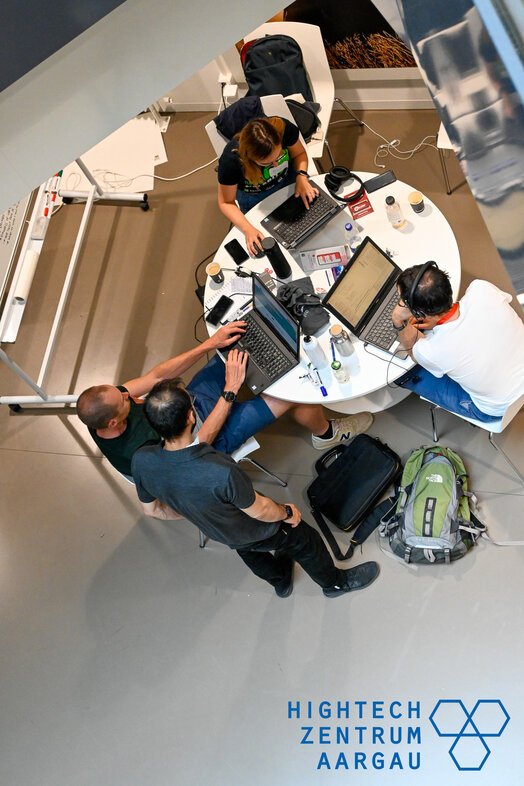
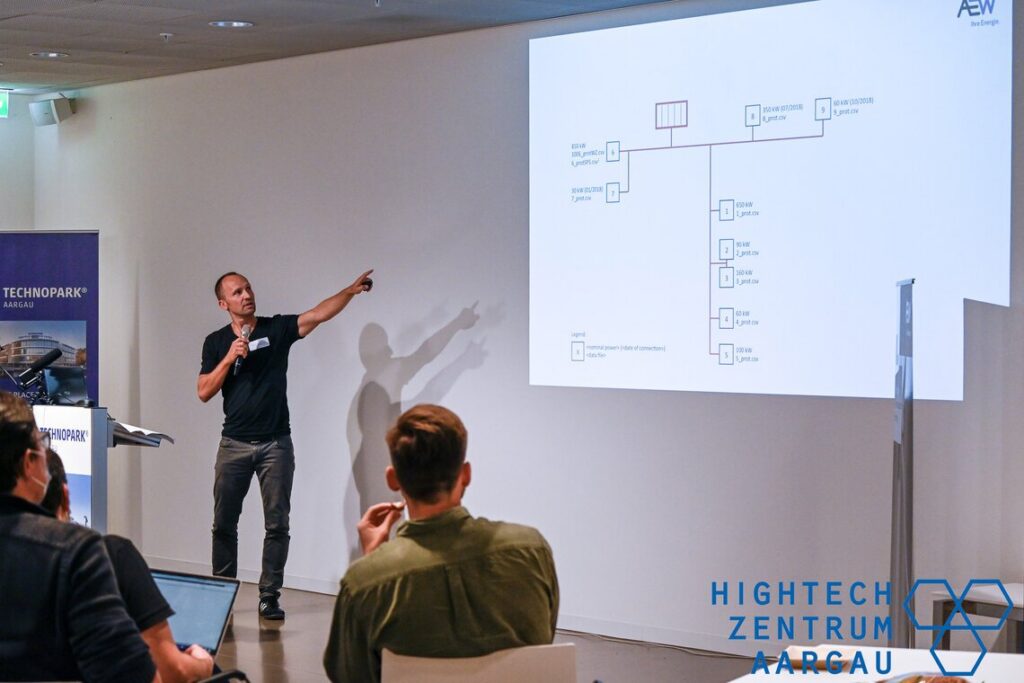
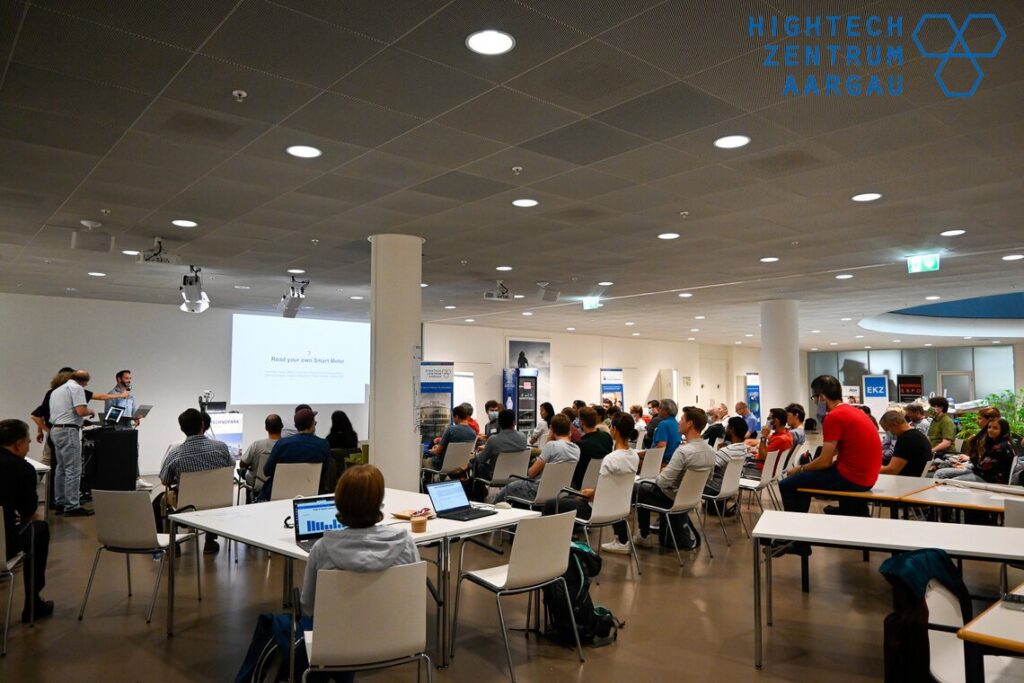
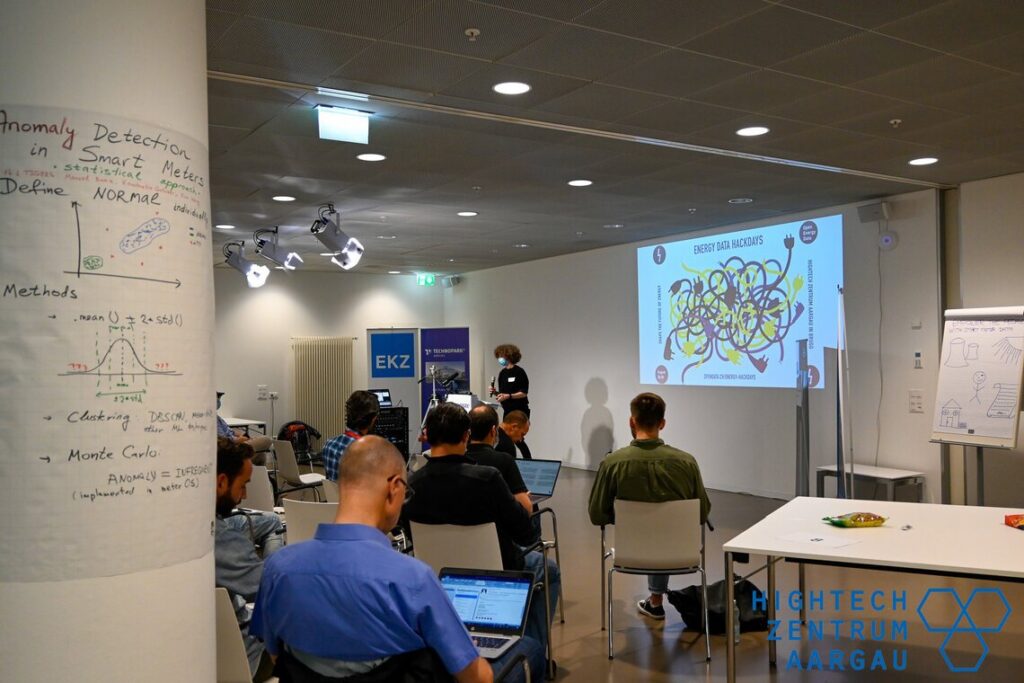
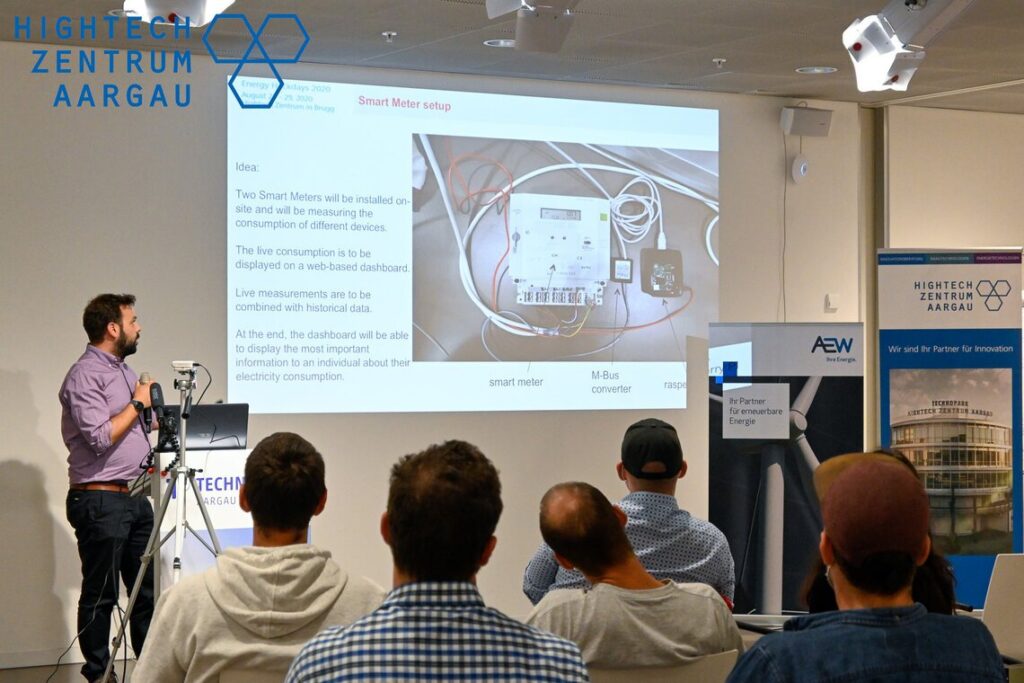
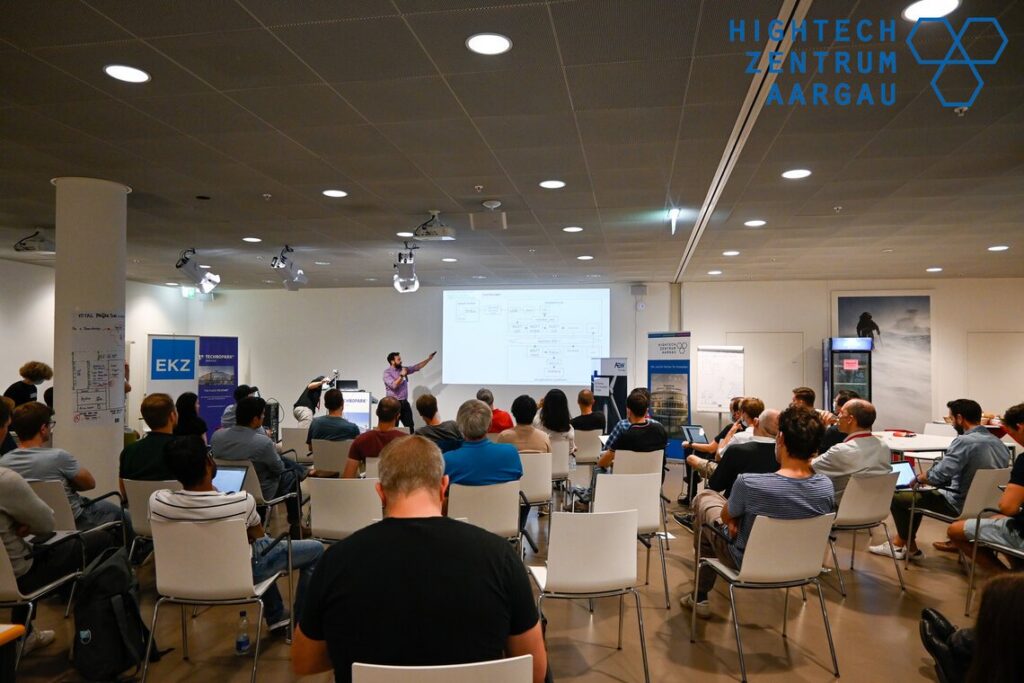
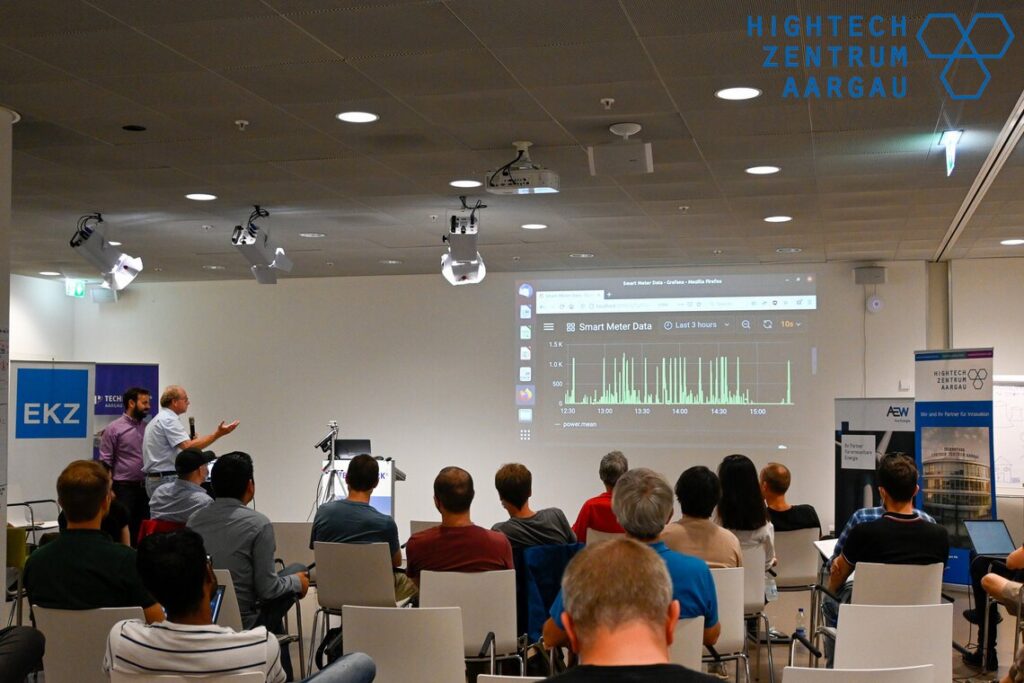
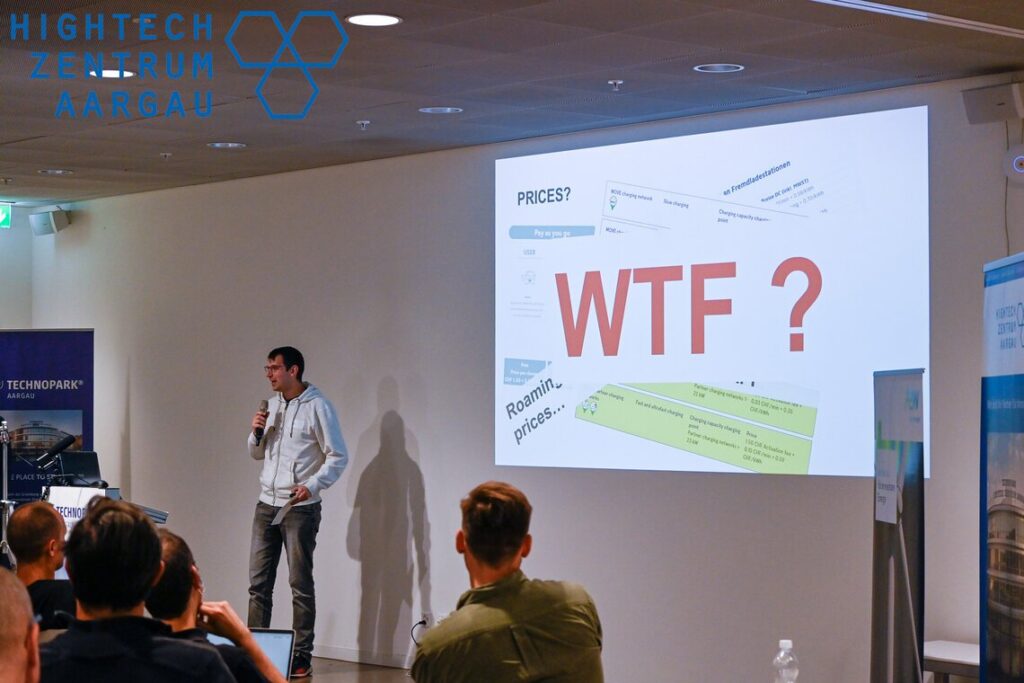
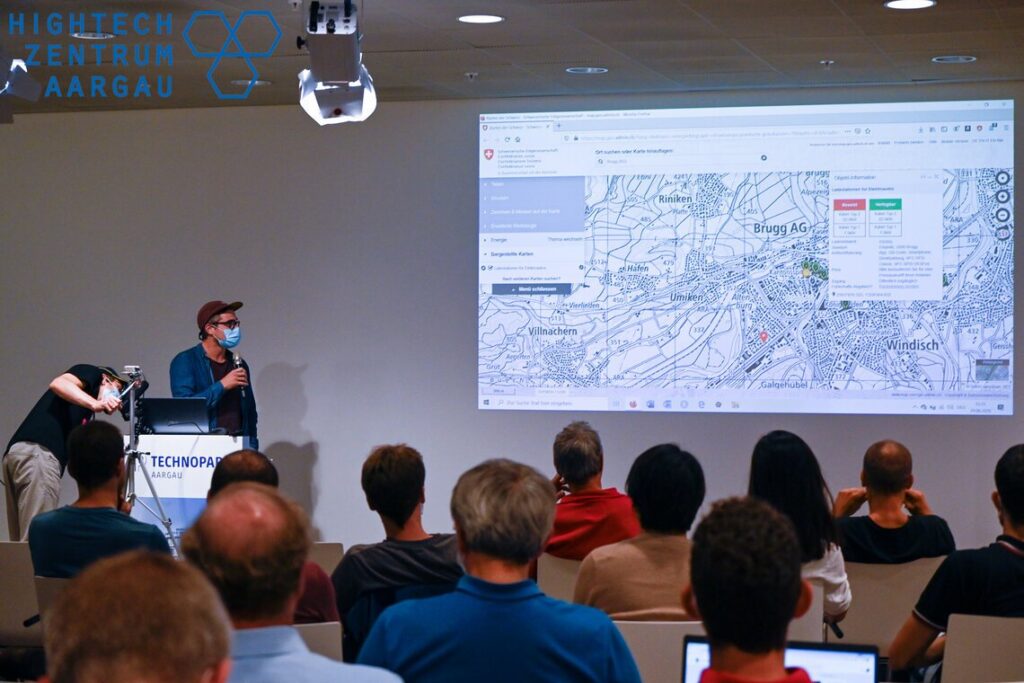
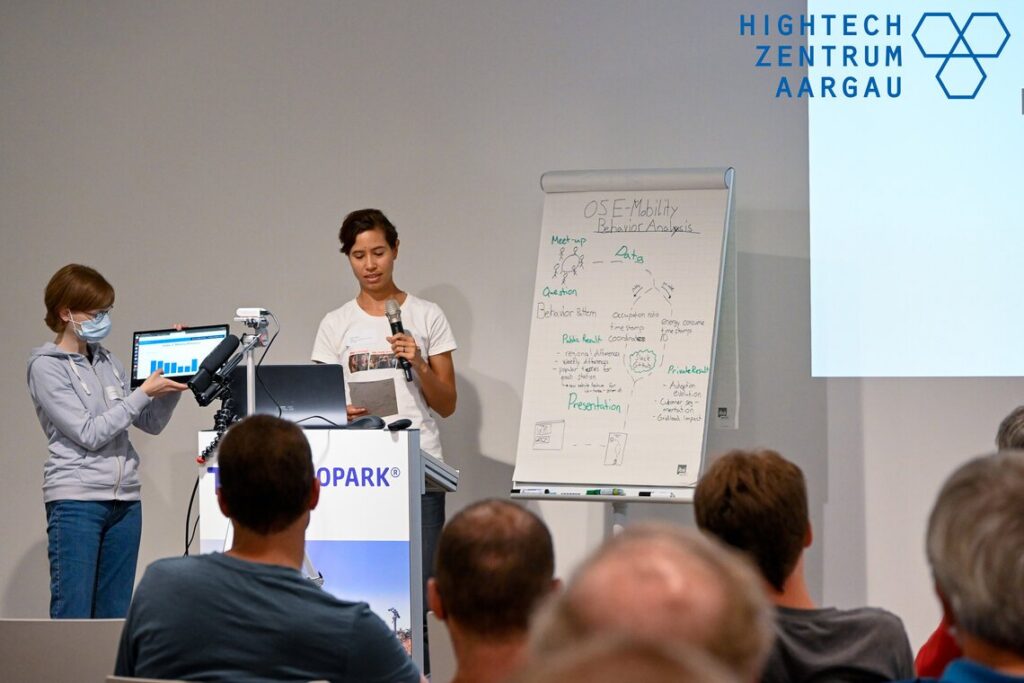
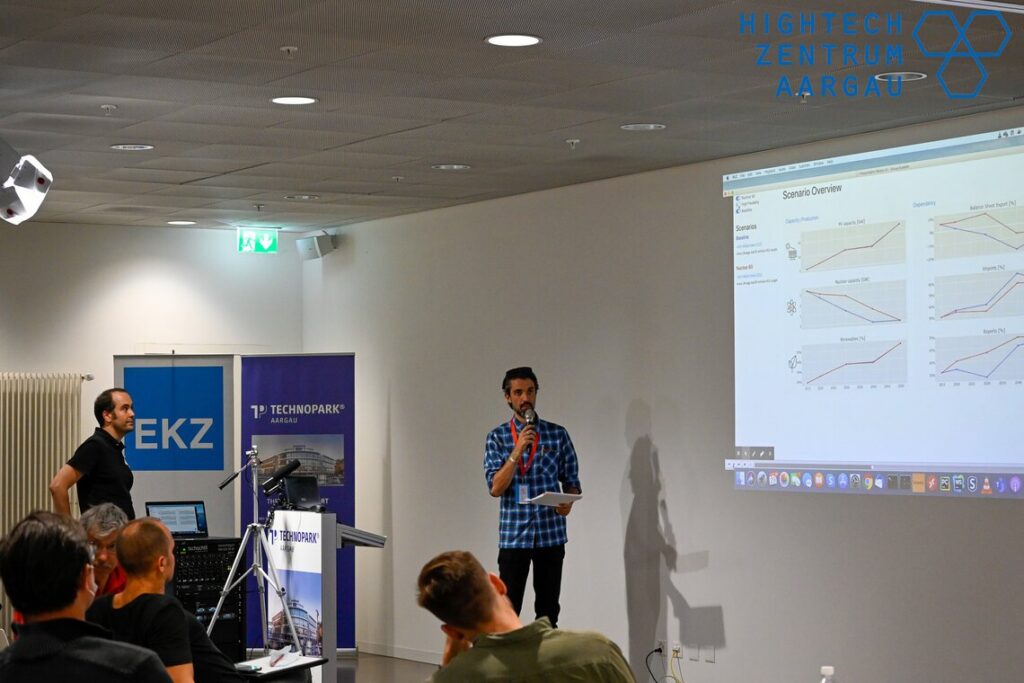
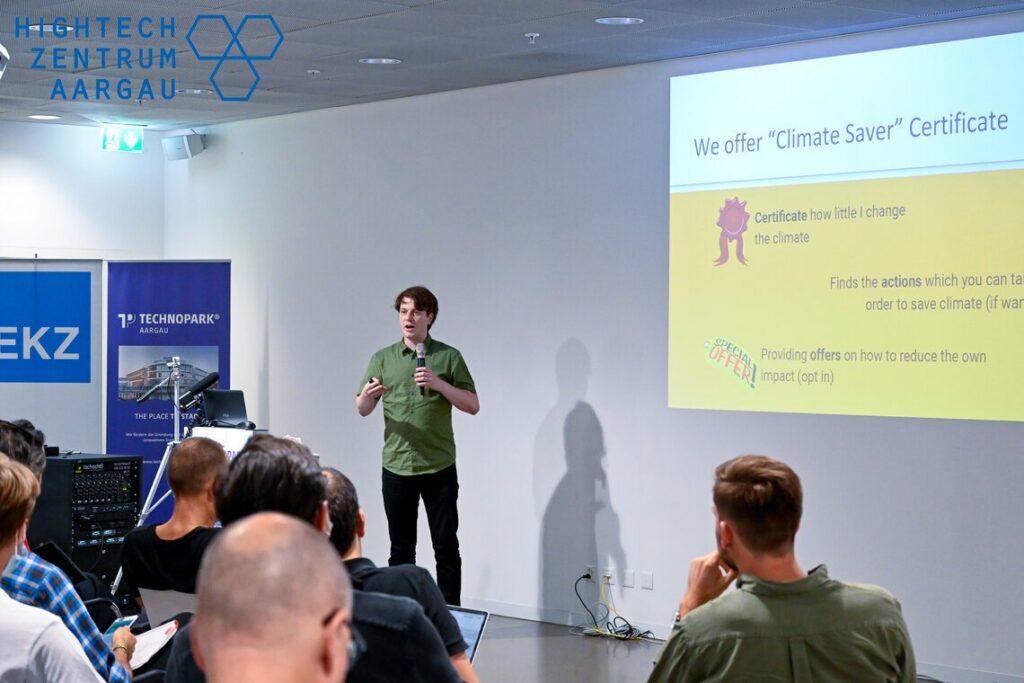
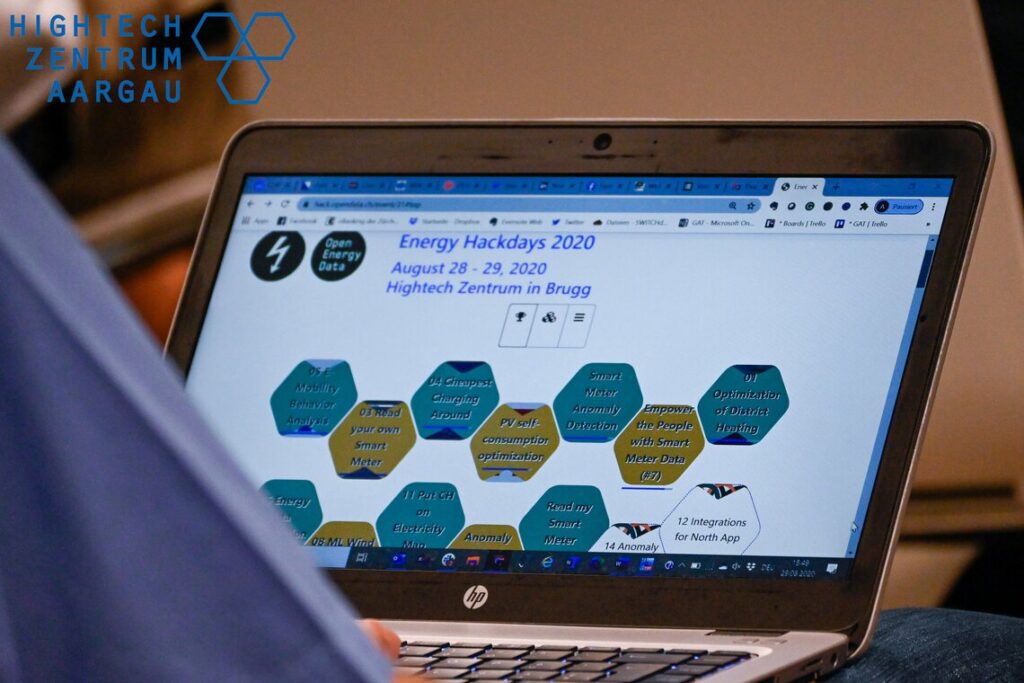
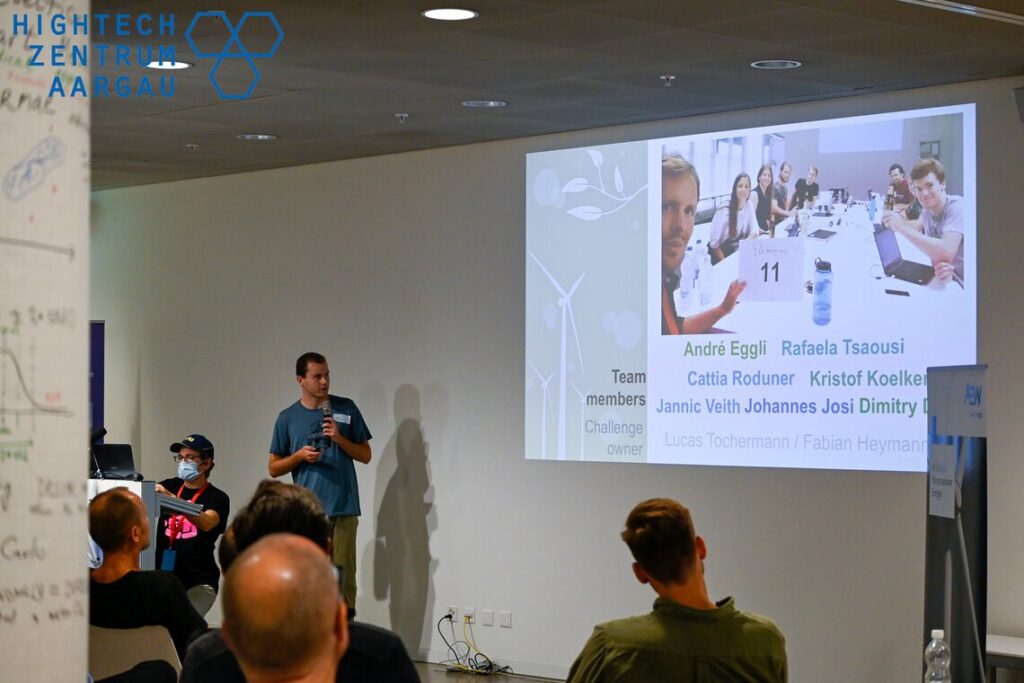
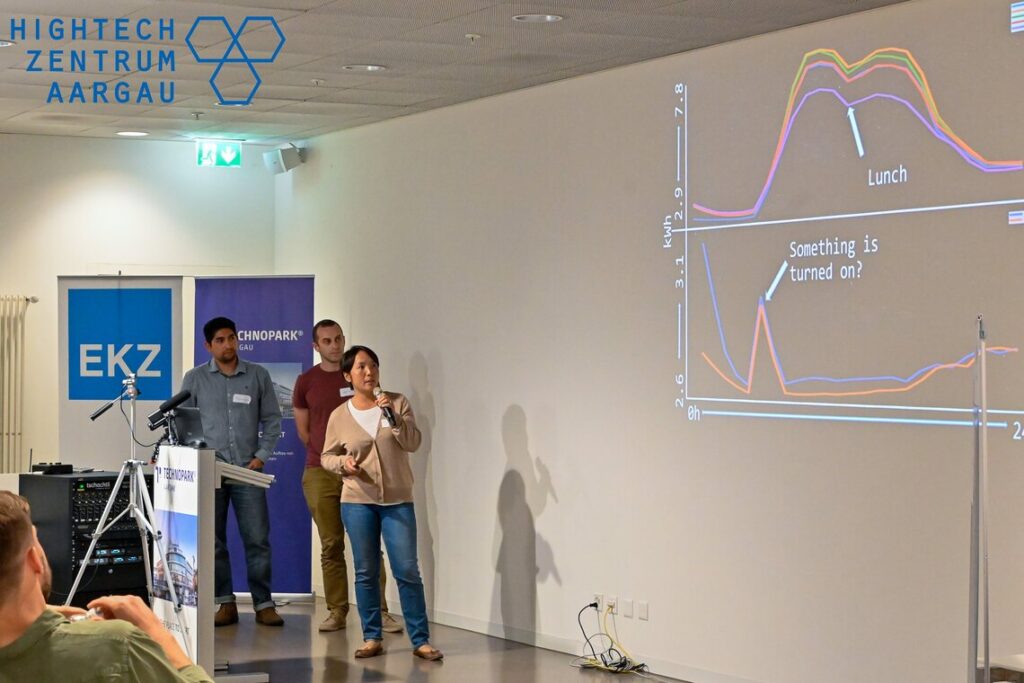
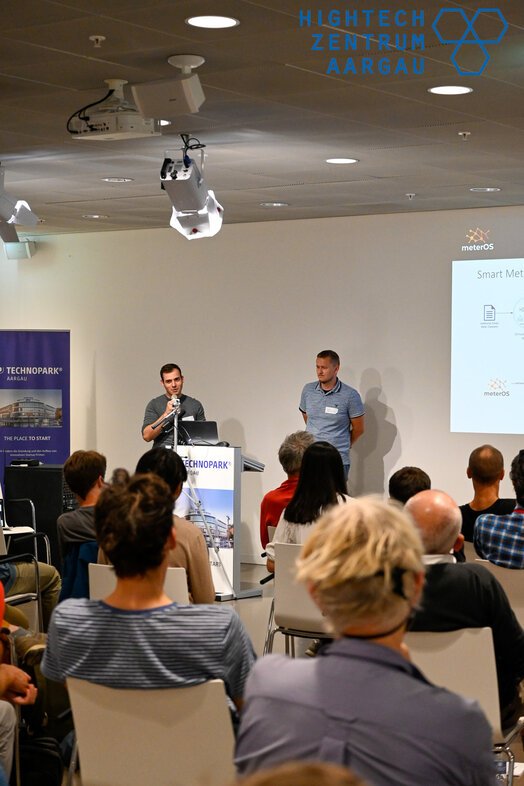
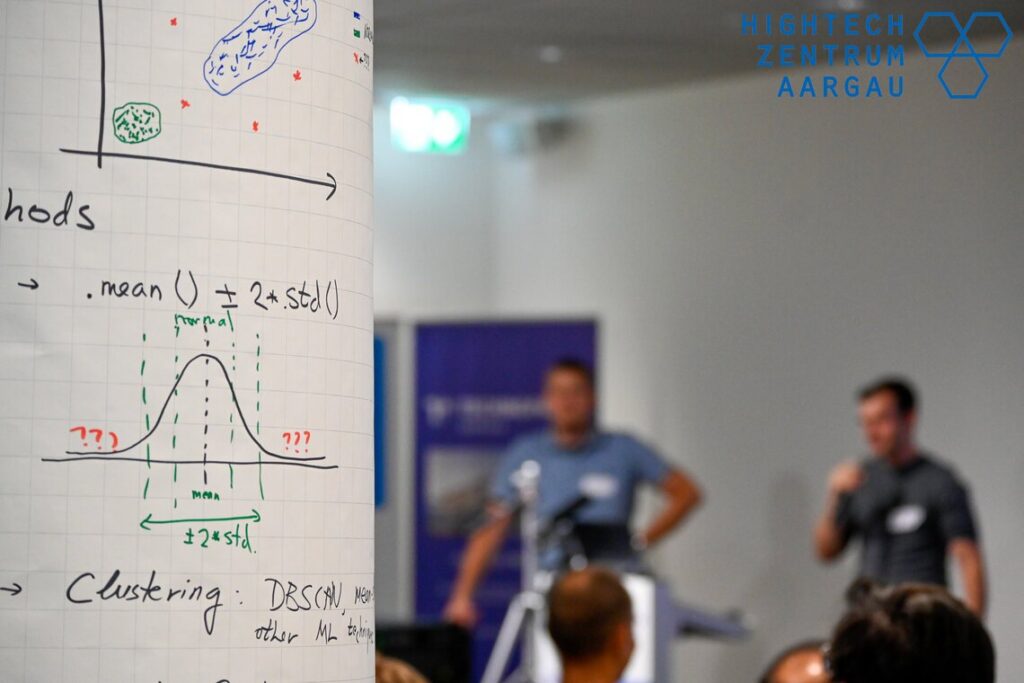
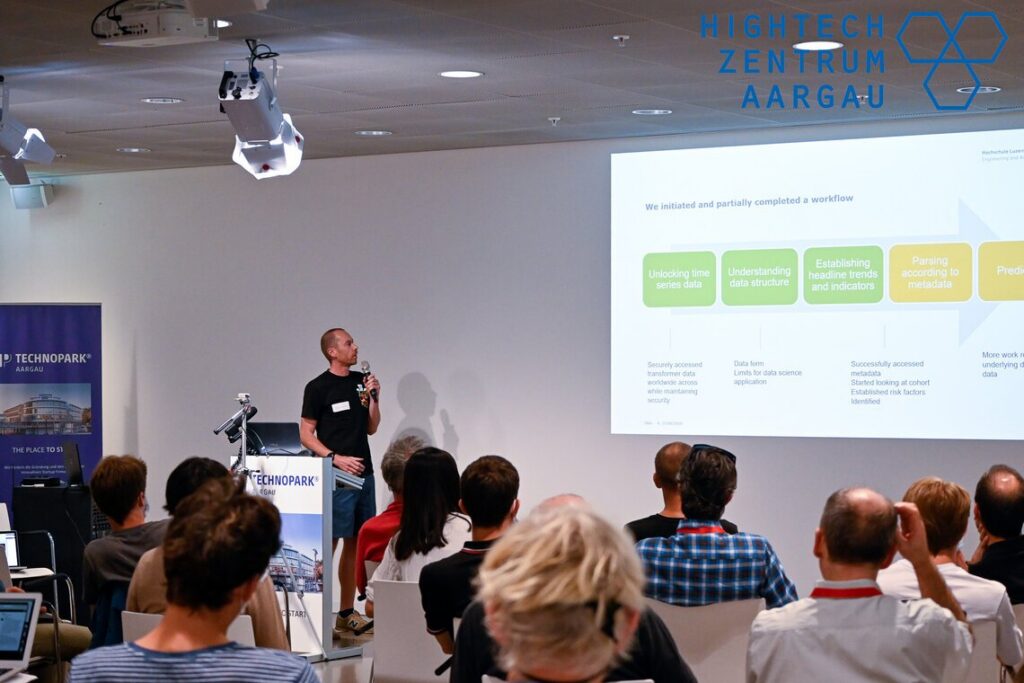
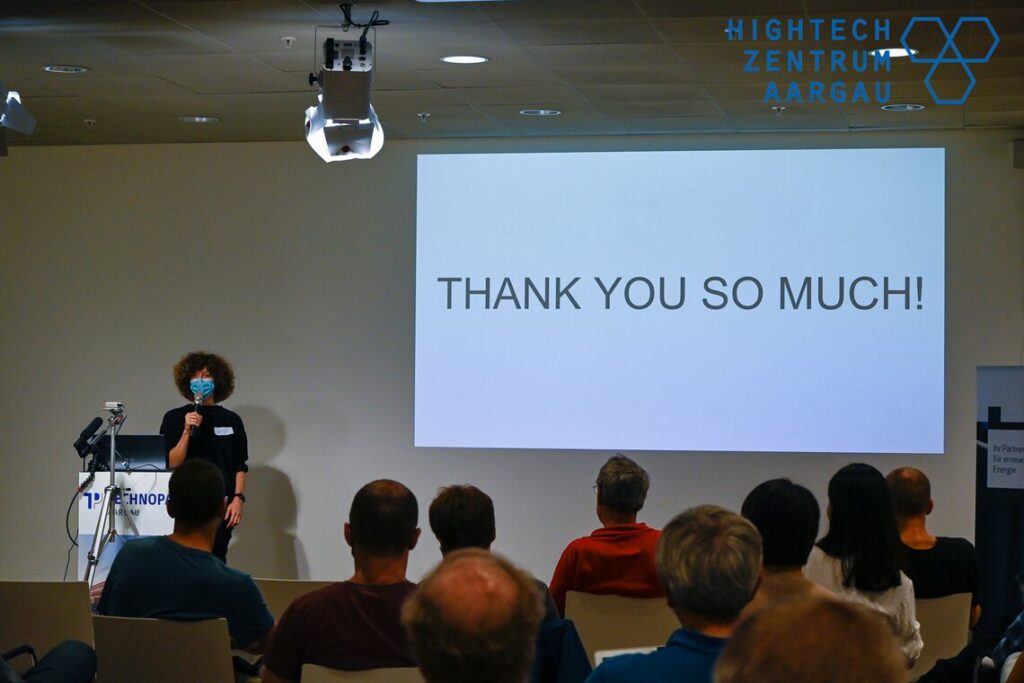
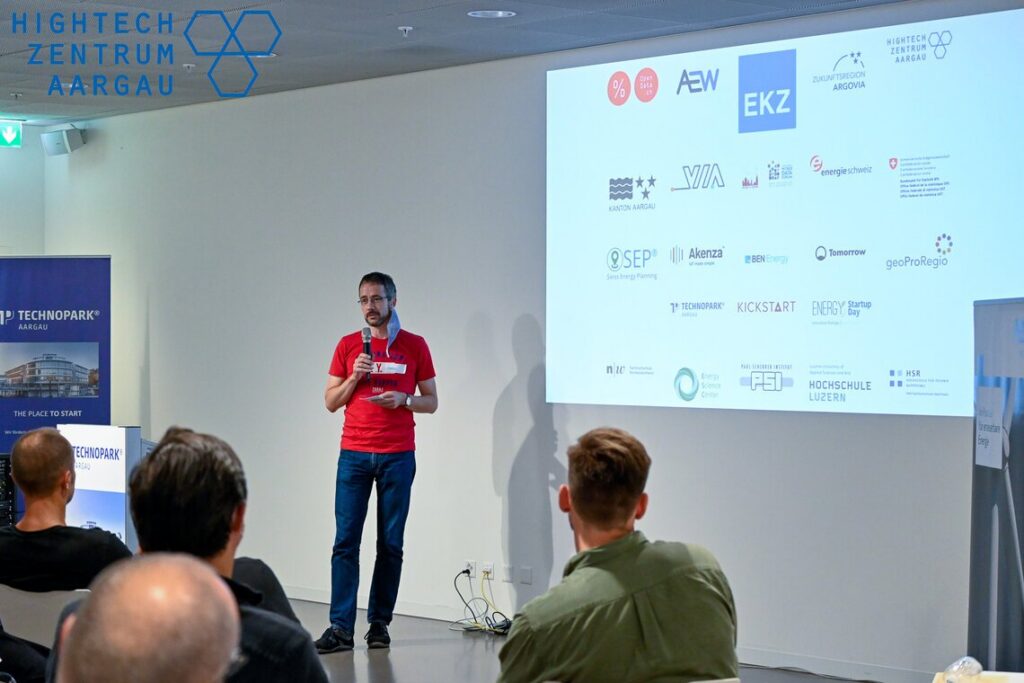
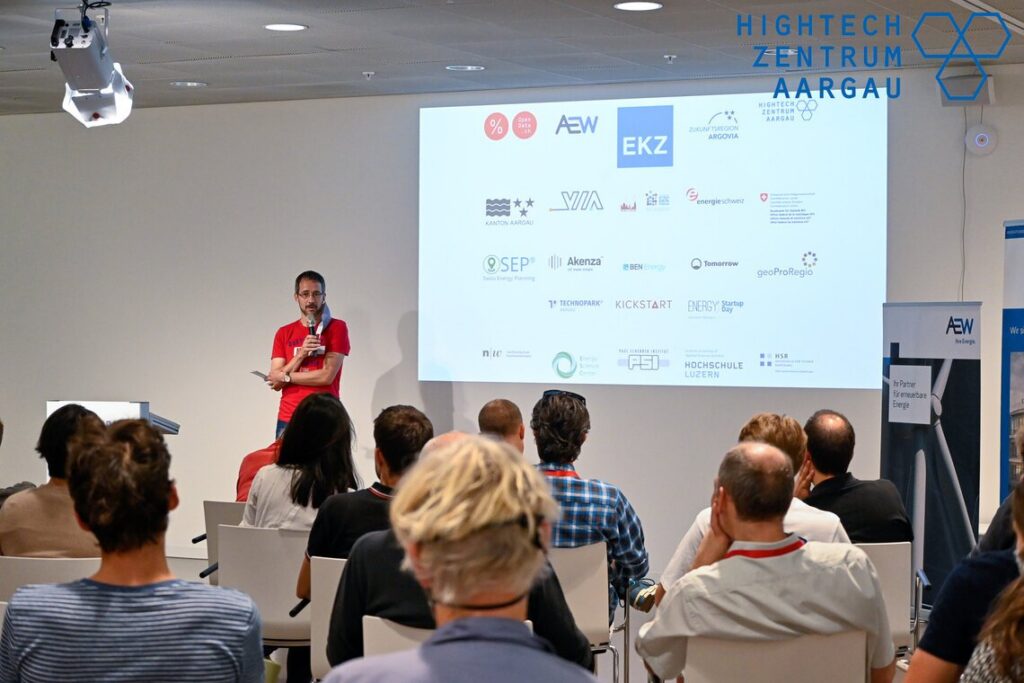
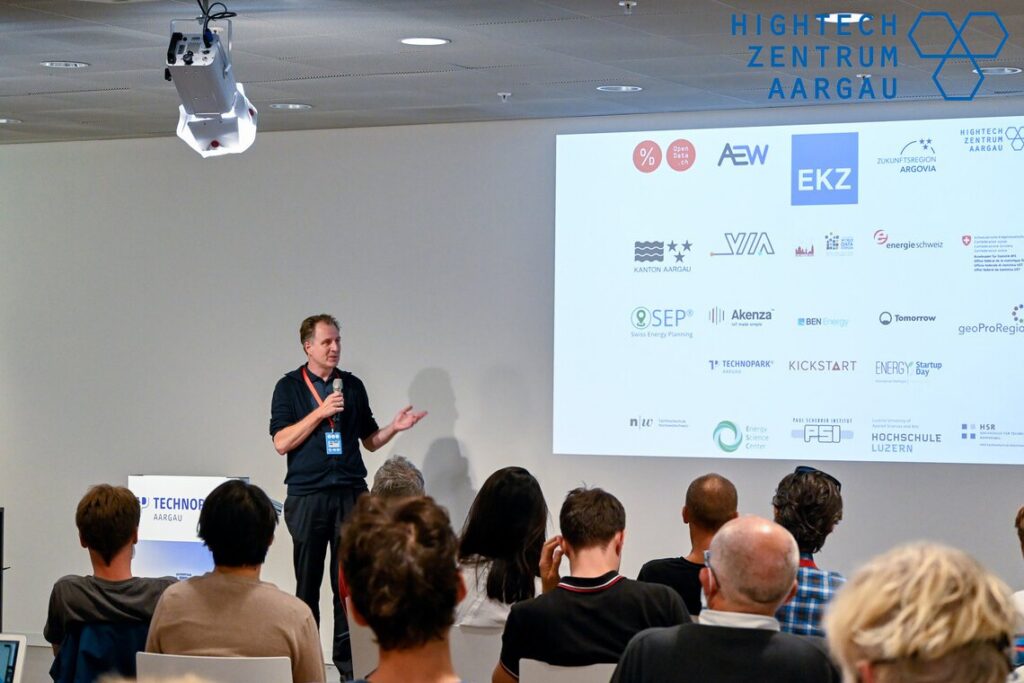
Photo: Nadine Zielinski / Hightech Zentrum Aargau
Documentation and recordings
- #energyhack2020 Livestream Tag 1: Begrüssung und Pitches der Challenges
- #energyhack2020 Livestream Tag 2, Teil 1: Schlusspräsentationen
- #energyhack2020 Livestream Tag 2, Teil 2: Schlusspräsentationen
- #hackdaysreport Energy Data Hackdays 2020: die Resultate! (opendata.ch, 6.10.2020)
- Projekte auf hack.opendata.ch (Event 31)
- Tag 1 | Energy Data Hackdays (Hightech Zentrum Aargau)
- Tag 2 | Energy Data Hackdays (Hightech Zentrum Aargau)
- Moderationsfolien der beiden Tage
Challenges
- Anomaly Detection in Smart Meter Data – CLEMAP
Participants are asked to use machine learning in order to identify abnormal consumption from smart meter data.
Challenge description
Challenge Description (#14)
Energy consumption in buildings and industry is often wasted due to user behaviour, human error, and poorly performing equipment. In this context, identifying abnormal consumption power behavior can be an important part of reducing peak energy consumption and changing undesirable user behavior. With the widespread rollouts of smart meters, normal operating consumption can be learned over time and used to identify or flag abnormal consumption. Such information can help indicate to users when their equipment is not operating as normal and can help to change user behavior or to even indicate what the problem appliances may be to implement lasting changes.
This challenge is looking for data scientists to apply their skills to an anomaly detection problem using smart meter data. Ideally, such an algorithm should begin to operate after as little as 3 months and should improve over time. A platform to visualise the anomalies would also be useful. Users can select any type of machine learning algorithms that they wish to in order to detect the anomalies from the data.
Data
A sample including smart meter data can be found on kaggle . Participants are encouraged to find other smart meter data to work with in order to test their algorithms.
- Cheapest Charging Around – Elektrizitätswerke des Kantons Zürich (EKZ)
Weiterentwicklung der BfE-Info-Plattform; «Ich tanke Strom.ch»; Verbesserung der Transparenz
Challenge description
(English below)
#Günstigste Lademöglichkeit in der Umgebung (#4)Ziel
Weiterentwicklung der GIS-Plattform vom Bundesamt für Energie (BFE): Preisinformationen integrieren und die günstigste Lademöglichkeit in der Nähe für Elektroautofahrer finden.
Idee:
Ein Charge Point Operator (CPO) ist eine Firma, die einen Ladestationen-Pool betreibt. Der CPO stellt smarte Ladestationen den E-Mobility Service Providern zur Verfügung (EMPs). Ein EMP ist eine Firma, die Ladeleistungen den Elektroautofahrern anbietet, z. B. mit einer Zugangskarte zur Identifizierung und Aktivierung des Ladenvorgangs und entsprechenden Ladeabonnements. Der EMP ermöglicht dem User den Zugang zu einer Auswahl von Ladestationen in einer bestimmten Region. Eine Firma kann beides CPO und EMP sein.
Unterschiedliche EMPs haben unterschiedliche Preise für das Laden an der gleichen Ladestation. Die Idee ist, die günstigste Lademöglichkeit für den Kunden eines bestimmten oder mehrerer EMPs zu finden.##Warum:
Grosse Preisunterschiede existieren heute zwischen den unterschiedlichen EMP Preisen für das Laden an der gleichen Ladestation. Diese Lösung soll die Kunden besser informieren und ihnen helfen, die beste Preisoption auszuwählen. Die Transparenz ist erhöht und die Market Performance ist verbessert.##Data
Ich-tanke-strom.ch auslesen
Preisinformationen von EMP/CPO Webseiten auslesen
Statistical and availability information available in .json format: https://opendata.swiss/dataset/ladestationen-fuer-elektroautos.
#Cheapest charging around
E-Mobility - further development of ich-tanke-strom.chGoal:
Further development of the GIS platform of the Swiss Federal Office of Energy (SFOE): Add price information to the charging stations and find the cheapest option around for electric car drivers.
##Idea:
A Charge Point Operator (CPO) is a company operating a pool of charging points. A CPO provides value by connecting smart charging devices to E-Mobility Service Providers (EMPs). An EMP is a company offering an EV charging service to EV drivers. EMPs provide value by enabling access to a variety of charging points around a geographic area. One company can be CPO and EMP at the same time.As a result, at each charging station of a certain CPO pool, different EMPs have different prices. The idea is to find the cheapest charging station around a user according to their EMP subscription(s).
Big picture:
Big differences in EMP prices exist at certain charging stations. This solution should help users to choose the best pricing options. Transparency and market performance is increased and the user/consumer is better informed.
Data:
Get information from Ich-tanke-strom.ch
Get information from EMP/CPO websites
Statistical and availability information available in .json format: https://opendata.swiss/dataset/ladestationen-fuer-elektroautos.
Update: Removed old not continued documentation: https://md.schoolofdata.ch/7wV5czYKSb2R6_zJiD8PyA#
28.08.2020 19:11
- Client-Analysis 2.0
and the power of open data
Challenge description
Slides
Notebook
►PitchThis project was worked on during the virtual Hackdays in March . / An diesem Projekt wurde während der virtuellen Ausgabe im März gearbeitet.
Challenge
Kundensegmentierung/-Analyse auf Basis offener Daten vs Daten eines Energieversorgungsunternehmens . Beispiele haben bereits gezeigt, dass eine Kundenanalyse/Kundensegmentierung auf Basis offener Daten bereits möglich ist und es keine Kundendaten mehr benötigt. Ist dem so und wenn ja, wie sieht es aus?
- Distributed analytics for asset management – VIA Science, Hochschule Luzern
Using AI to predict how power transformers will fail, and what to watch out for
Ben BowlerChallenge description
(Challenge #13)
This task will create a decision support tool for asset managers. The utility asset manager will be able to put results of transformer inspections into the tool and receive:
A health value for the transformer ("condition-based rating")
A comparison of the transformer's health with other transformers from all over the world
Possible faults, based in particular on gas levels
A prediction on how the transformer's health will degrade in the next 1-2 years, based on how similar transformers have behaved
Advice on what gas levels to monitor, and how to watch them
A central part of the task is to conduct the analysis without a centralised dataset, and without being able to see the asset information of other transformers. The analyst is working blind to protect the privacy of the transformer owners! This is achieved using TAC, a system provided by the challenge sponsor, VIA.
The steps we are taking in the hackathon are:
To identify typical condition curves
To match these curves to the test transformer
To map the changes in health over time for the matching transformer, in particular looking at gas levels
To predict how the test transformer will change with time by generating a heatmap and plotting the test transformer to the heatmap
Visualisation and business value!
We have four datasets that we can use:
A global repository of transformers that we access using VIA's privacy-preserving TAC system (including fault information)
An anonoymised database of Swiss transformers
A list of faulty transformer readings, from the IEC60590 standard
A list of normal transformer readings, from the IEC60950 standard
The decision support tool will be combined with online and offline asset management approaches. It will be combined with load and geospatial data to create an exploitable tool.
31.08.2020 12:37
Prototyping has been completed and now the project will be taken forward for funding
31.08.2020 12:38
- E-Mobility Behavior Analysis – Elektrizitätswerke des Kantons Zürich (EKZ)
Challenge description
(English below)
#Analyse E-Mobilitätsverhalten (#5)
##Ziel:
Antworten auf Fragen bezüglich Mobilitäts- und Ladeverhalten in der neuen Ära der Elektromobilität.
##Idee:
Öffentliche und historische Daten analysieren, um Klarheit bezüglich des Themas Elektroautos zu schaffen und Fragen beantworten, wie:Wie und wann bewegen sich Menschen heute?
Wie, wann und wo laden Elektroautofahrer ihre Autos?
Wie vergleicht sich eine öffentliche mit einer privaten Ladestation bezüglich Nutzung, Nutzungszeit, Nutzungsdauer usw.?
…?
##Warum?
Die heutige Situation der Elektromobilität verstehen, so dass man sich die Zukunft vorstellen kann und den benötigten Infrastrukturausbau (Verteilnetz, private Ladeinfrastruktur zu Hause) planen kann.
##Daten:Anonymisierte Profile von privaten Ladestationen in Mehrfamilienhäusern
Historische Daten von öffentlichen Ladestationen aus ich-tanke-strom.ch (10GB Daten Feb. - Aug. 2020)
Öffentliche Daten aus anderen Quellen
#E-Mobility behavior analysis
##Goal:
Find answers to questions regarding mobility and charging behavior in the new era of electric mobility.
##Idea:
Analyze open and historical data to get a clear understanding of the situation regarding electric cars by answering questions like the following:How and when do people move?
How, when and where do people charge their electric cars?
How does a public charging station compare to a private one in terms of utilization, time of use etc.?
…?
##Big Picture:
Understand the present situation regarding electric mobility in order to be able to imagine how the future will look like and plan the infrastructure development needed (electrical distribution grid, charging infrastructure at home) accordingly.##Data:
Anonymized profiles of private charging stations in multi-family homes
Historical data of public charging stations from ich-tanke-strom.ch (10GB of data from Feb. to Aug. 2020)
Open data from other sources
28.08.2020 13:24
28.08.2020 17:34 mockup for our emobility behaviour dashboard done.
29.08.2020 13:11 presentation & live demo of our amazing dashboard
- Empower the People with Smart Meter Data – Hochschule Luzern, Fachhochschule Nordwestschweiz
Challenge description
(Challenge #7)
Novel energy certificate assesses where and how strongly building / user behaviour causes deviation from theoretical/optimum behaviour.
💭 What problem are you solving?
Empowering people to understand what they can do to take action against climate change.
💡 How are you solving that problem?
Monitoring of people’s energy consumption, with the implementation of a rating system to understand how good they and the building they are living in are. Personalized information about what they can do to improve themselves is then presented. For example: for additional x Fr./month, get 100% electricity from renewable sources and move to category A.
🗽 What have you achieved during the Hackdays?
A new business concept for smart meter data.
📮 Include links to source code or prototypes.
📎 Indicate any relevant terms or licenses on your work.
Live or frequently updated and historic smart meter data.
🎢 What issues have you encountered, for example in regards to the data you wanted to use?
Choosing the most impactful customer, addressing the exact issue which is tackled by our solution.
Data will most probably not come from one unique source, but from a variety of sources.
The users should authorize data hosters to use their data.💹 Which data have you used? Format…? Permissions?
Finding business partners, implementing the new certificate, and build a solid user base.- Federal office of energy/statistics (public data),
VSE Homepage (public data)
Customer segmentation data from City Energy Provider of St. Gallen (confidential)
Smart meters data (from public utilities)
Building characteristics (from Building and Dwelling register)
Weather data
🗻 What are the next steps?
Finding business partners, implementing the new certificate, and build a solid user base.
💁 Who are you and your team mates, and how can you best be contacted?
Clara Esteve, Jeremias Rehn, Philipp Schütz, Wim Ton, Holger Wache
29.08.2020 12:36 Initial project release
- Energy data visualization – Energy Science Center ETH Zürich
Energy data are diverse. How do we present them interactively and informatively?
Challenge description
Big picture: (Challenge #6)
Integrated Energy System models produce a large amount of results, with a wealth of information. There need to be interactive tools to explore this data by drilling down the data sets.
Idea:
Based on databases containing the results, a concept for the visualisation (including data plots/charts) as well as the actual implementation with modern and open-source web publishing and programming tools has to be implemented. It might also be used to display input parameters.
We provide:
Our knowledge and help
Flexibility to choose a focus
Clearly defined questions
Cleaned and structured data
Established Python-based framework
Opportunity to see your idea in production soon
We expect:
Your creativity!
Current framework:
(not restrictive):
Python
Plotly
CSV
29.08.2020 09:07
New landing Page with Scenario overview
UI Improvements:Dynamic triggered graphs.
Immediate trigger of Graph plot on change of parameters or scenario
Moving Scenario Tabs to center page
29.08.2020 12:42
Prototype finished - ready for presentation. - Integrations for North App – Tomorrow
Reduce your climate Impact CH
Challenge description
##Goal: (Challenge #12)
Reduce your climate Impact CH
It is time to address the issue of "the power of data" in relation to climate here in Switzerland.
The goal is a visualization / an app that visualizes and makes the carbon footprint of the consumer perceptible - e.g. melting polar caps or number of trees to be planted or running kilometers.
Ideally via electricity, gas and heat consumption. Not only that, if one would connect this with comparison options - e.g. heat pumps, etc. one could sensitize immediately the final consumers to better devices to change over - the whole if necessary with climatic bonus points underlaid.##Data:
We are providing you with links to this open source app, and we have discussed with the developers what possible integrations would be useful for Switzerland.
Just as an example: SBB data, PostAuto, lake cruises data, delivery services (Digitec, DHL, ..), BLS or VBZ transport providers all have open data available.
Can you try to implement so of these?available Smart Meter data of utilities
Data structures from electricity map with assumptions on the Swiss production mix at certain times based on ENTSo-E (transparency platform) electricity mix at certain times and data from published electricity statistics for Switzerland (previous year).
Use of certain assumptions/data from our "renewable heating" programme, which includes an online calculation tool for comparison technologies (gas, WP, oil), etc.
- LocationAI
Know the neighbourhood of your customer
Challenge description
Slides
Demo
►PitchThis project was worked on during the virtual Hackdays in March . / An diesem Projekt wurde während der virtuellen Ausgabe im März gearbeitet.
Note: demo works however only for the Germany Nord Rhein Westfallia (Cologne, Dusseldorf, Munster and so on)
Challenge
Kundensegmentierung/-Analyse auf Basis offener Daten vs Daten eines Energieversorgungsunternehmens . Beispiele haben bereits gezeigt, dass eine Kundenanalyse/Kundensegmentierung auf Basis offener Daten bereits möglich ist und es keine Kundendaten mehr benötigt. Ist dem so und wenn ja, wie sieht es aus?
- ML Wind Power-Prediction – OST – Ostschweizer Fachhochschule (damals HSR)
Challenge description
Recording
Slides
In EnglishZiel: (Challenge #8)
Entwicklung von Machine Learning-Algorithmen (oder Tools/Apps) für verbesserte standortspezifische Leistungsprognosen von Windenergieanlagen.
Entwicklung von alternativen Algorithmen z.B. Artificial Neural Networks
##Idee:
Die genaue Vorhersage der Stromproduktion einer Windkraftanlage an einem bestimmten Standort ist sowohl in der Planungs- als auch in der Betriebsphase wichtig, aber die standardmäßige Methode zur Speicherung von Leistungskurven ist nicht spezifisch für die atmosphärischen Bedingungen am Standort und kann daher ungenau sein. Das Ziel dieser Herausforderung ist die Entwicklung eines Algorithmus für maschinelles Lernen, um die Genauigkeit der standortspezifischen Leistungskurvenvorhersage zu verbessern. Dazu wird Ihnen ein Datensatz von 8'000 simulierten Leistungen der NREL 5MW-Referenzwindturbine aus dem Simulationswerkzeug ASHES bei verschiedenen atmosphärischen Bedingungen zur Verfügung gestellt. Dieser neue Algorithmus könnte in einem zukünftigen Innovationsprojekt zu einem Werkzeug für Windparkbetreiber entwickelt werden.##Daten:
Ein Datensatz von 8'000 simulierten Leistungen der NREL 5MW-Referenzwindturbine aus dem Simulationswerkzeug ASHES bei verschiedenen atmosphärischen Bedingungen wird zur Verfügung gestellt.
#Machine Learning Wind Turbine Power Curve Prediction
Goal:
Development of machine learning algorithms (or tools/aps) for improved site-specific performance prediction of wind turbines.
Development of alternative algorithms e.g. Artificial Neural Networks
Idea:
The accurate prediction of the power production of a wind turbine at a particular site is important in both the planning and operation phases, but the standard power curve binning method is not specific to the atmospheric conditions at the site and can therefore be inaccurate. The goal of this challenge is to develop a machine learning algorithm in order to improve site-specific power curve prediction accuracy.
This new algorithm could be developed into a tool for wind farm operators in a future innovation project.
##Data
For this challenge, you will be provided with a dataset of 8'000 simulated powers of the NREL 5MW reference wind turbine from the simulation tool ASHES at a range of different atmospheric conditions.Download data here: https://github.com/sarah-barber/powercurve/tree/master
29.08.2020 10:54 Project updated
- ML: Knowledge discovery from energy data
Energy data has multiple dimensions. Where are the most surprising changes?
Challenge description
(Challenge #15)
We provide:
Our knowledge and help
Cleaned and structured data
Opportunity to apply and deepen your idea in an ongoing projectWe expect:
Your creativity
Your interest and expertise in data mining##Current framework (not restrictive):
Python
CSV (~50MB)
- Optimization of District Heating – AEW Energie AG
Energieverbrauch von Fernwärmeanlagen minimieren, insb. der Einsatz von Spitzenlast-Kesseln (fossile Brennstoffen)
Challenge description
Challenge #1
- PV Optimisation – AEW Energie AG
Challenge description
Notebook
(English below)
##Ziel (Challenge #2)
Tool-Aspekt: Aus Input (Erzeugungs- und Lastzeitreihen) wird eine Analyse zum Optimierungspotential erstellt (über das ganze Jahr bzw. den ganzen Zeitraum betrachtet). Ein Fokus liegt auf aussagekräftigen Visualisierungen (z.B. Zoom-Möglichkeit, aggregierte Darstellungen, etc.).##Idee
Analyse von Erzeugungs- und Lastzeitreihen im Hinblick auf Optimierungsmöglichkeiten (Eigenverbrauch).
Darstellung von Kennwerten wie theoretisch möglicher Eigenverbrauchsgrad (energetisch) je Monat/Tag.
Identifikation von systematischen Mustern, die Optimierungspotential bieten (z.B. regelmässige Lastspitzen in der Nacht; Einbezug der Erzeugung: wenn die Sonne nicht scheint, gibt's auch nichts zu optimieren, etc.).
Dimensionierung eines Speichers (Sensitivitäten auf Leistungsbegrenzung, etc. darstellen).
Berücksichtigen der Tarifstruktur (zeitlich)
##Daten
Daten von zwei grossen AEW PV-Anlagen: https://github.com/zuzfil/PV-Optimisation.
PV Optimisation
Goal:
Tool aspect: An analysis of the optimisation potential is created from input (generation and load time series) (viewed over the entire year or period). One focus is on meaningful visualizations (e.g. zoom option, aggregated representations, etc.)
Idea:
Analysis of generation and load time series with regard to optimisation possibilities (own consumption).
Presentation of characteristic values such as theoretically possible degree of own consumption (energetic) per month/day.
Identification of systematic patterns that offer optimization potential (e.g. regular load peaks at night; inclusion of generation: if the sun does not shine, there is nothing to optimize, etc.).
Dimensioning of a storage tank (display sensitivities to power limitation, etc.).
Taking into account the tariff structure (temporal)Data
Data sets of two large AEW-owned PV plants: https://github.com/zuzfil/PV-Optimisation.
28.08.2020 12:21 Hey I am just presenting this project on the stage. And we haven't even started yet. How cool is that?
29.08.2020 10:39 Switching this back to Challenge status, since work is now being done on this data here: https://hack.opendata.ch/project/599
- PV self-consumption optimization – AEW Energie AG
Evaluate and optimize trade-offs in the design of battery storage for PV systems
Andreas Mueller Roger Langenegger
Challenge description
With the AEW data of a 60 kWp PV installation, we optimized the solar energy self-consumption by a battery system. For this, we calculated different parameters such as battery load, new self-consumption and new grid supply and estimated the optimal battery capacity with further values such as energy and battery prices, life span, contract duration, minimal charge, maximum load power in Google sheet and as well with Python.
Finally, our customer can select, whether he wants the most economical battery solution or maximise his autarky. Our tools calculate the maximized economic benefit over lifetime.
Google Sheet Prototyp
Create a copy
Github
Contains initial Python implementation and some exploratory analysis, see also README below.
29.08.2020 12:02
- Performance GAP Buildings – Hightech Zentrum Aargau AG
Challenge description
#Idee:
Was wäre wenn?
Der Gebäudesektor ist einer der grossen Energieverbraucher. Rund ein Drittel des gesamten Energieverbrauchs entfällt auf die Gebäude.
Was verbraucht ein Haus und was könnte es im Idealfall verbrauchen? Wie erkennt man, ob ein Gebäude zu viel Strom/Wärme verbraucht?
Auf Basis der Challenge «Gebäudepass» (https://hack.opendata.ch/project/339) der Energy Data Hackdays 2019 könnte eine Weiterentwicklung hin zu einem spielerisch dargestellten Performance GAP ausgearbeitet werden. Wie könnte solch eine Visualisierung ausschauen? Was braucht es dafür?Potentiale Data Quellen:
GWR (Gebäude- und Wohnungsregister)
EVU CRM, Leitung-Kataster, ...
Sonnendach
Erdwärme
Feuerungs Datenbank
Pro Novo (SwissGrid Photovoltaik)
Evtl. dynamische Messdaten (Strom, Heizungsrechnung)
#Performance GAP buildings
##Idea:
What if?
The building sector is one of the largest energy consumers. Buildings account for around a third of total energy consumption.What does a building consume and what could it ideally consume? How can you tell whether a building consumes too much electricity/heat?
On the basis of the challenge "building passport" (https://hack.opendata.ch/project/339) of the Energy Data Hackdays 2019, a further development towards a playfully presented Performance GAP could be worked out. What could such a visualization look like? What does it need?
Potential Data sources:
GWR (Gebäude- und Wohnungsregister)
EVU CRM, Leitung-Kataster, ...
Sonnendach
Erdwärme
Feuerungs Datenbank
Pro Novo (SwissGrid Photovoltaik)
Evtl. dynamische Messdaten (Strom, Heizungsrechnung)
- Photovoltaic: Where is it Best? – Paul Scherrer Institut (PSI)
Where solar photovoltaics make the most sense
Challenge description
Notebook
►PitchThis project was worked on during the virtual Hackdays in March . / An diesem Projekt wurde während der virtuellen Ausgabe im März gearbeitet.
Challenge #10
( english below )
Warum:
Die Verbreitung der Solar-Photovoltaik in der Schweiz ist nur in grossem Umfang möglich, wenn sie wirtschaftlich sinnvoll ist und gleichzeitig die Treibhausgasemissionen reduziert.
##Idee:
Diese beiden Faktoren können durch einen Vergleich der Lebenszykluskosten (LCC) und der Lebenszyklustreibhausgasemissionen (LCE) mit ihrem lokalen Stromtarif und dem LCE des Strom-mixes der Versorgungsunternehmen bewertet werden. Die LCC und die LCE variieren für jedes einzelne PV-System, abhängig von ihrer Grösse, den erneuerbaren Ressourcen und anderen technischen Faktoren.Angesichts der bisherigen Erfahrungen des PSI über das PV-Erzeugungs-potenzial und -kosten kann diese Analyse durchgeführt werden, um mehr Erkenntnisse darüber zu gewinnen, wo der Einsatz von Solarphotovoltaik in der Schweiz am sinnvollsten ist.
Where solar photovoltaics make the most sense
##The big picture:
The rollout of solar photovoltaics to a great extent in Switzerland is only possible when they make economic sense and at the same time reduce greenhouse gas emissions.
Idea:
These two factors can be assessed by comparing the Life Cycle Cost (LCC) and Life Cycle greenhouse gas Emissions (LCE), with their local electricity tariff and the LCE of electricity mix supplied by utility providers. The LCC and LCE varies for each individual PV system, depending on their size, renewable resources, and other technical factors.
Given the previous experience on PV costs and generation potential , this analysis can be undertaken to give more insights on where it makes the most sense to deploy solar photovoltaics in Switzerland.
Call for expertise
GIS expert
Application/UI developer
Energy consultant/scientist
Expert from government/utilities working on PV system rollout/implementation
Questions to answer in two perspectives:
Country-wide (mainly analysis):
how much potential do we have for Switzerland considering LCC and LCE in a realistic senseIndividual resident (requires UI):
- Does it make sense to install PV on top of my roof
- How can I find residents around me with similar conditions/interest to reduce system investment cost (economy of scale)
Data
levelized cost of electricity for each roof in Switzerland from this analysis by Technology Assessment Group, Laboratory for Energy Systems Anlaysis, PSI
local electricity mix by electricity generation technology for municipalities and entities in 2018, obtained from Stromkennzeichnung
2 sources for PV potential in Switzerland
data from Sonnendach
data from Walch, A. 2020
life cycle greenhouse gas emissions (LCE) per kWh for different electricity generation technologies based on ecoinvent version 3.6
electricity tariffs in Switzerland from ElCom
simulating the performance of photovoltaic energy systems (pvlib-python)
is a community supported tool that provides a set of functions and classes for simulating the performance of photovoltaic energy systems. It was originally ported from the PVLIB MATLAB toolbox developed at Sandia National Laboratories.
see more on project gibhub page https://github.com/pvlib/pvlib-python
remuneration from electricity providers
an official portal providing numbers on compensating the electricity production using PV in households - pvtarif.ch
https://www.vese.ch/wp-content/uploads/pvtarif/pvtarif2/appPvMapExpert/pvtarif-map-expert-de.html
there is an API but the data license forbids any use of this data in digital form in research
Thinking process
In this project we did additional study and compiled research notes, sample data and suggestions, expanding on the original challenge
Limitations of the solardach.ch calculator
1.1 Number of factors: it considers factors like solar irradiance, angle of roof area, shading. The new study also considers additional factors like temperature (which affects the module efficiency), obstacle structure on roof (based on machine learning) = more realistic estimate --> use data from new study
1.2 Calculation not based on current technology/efficiency factor: Someone planning to build a new PV installation would (reasonably) use the latest technology, while most calculations by tools are based on averages (which consist of a mix of old and new technology). Estimates for kWh potential might be 1/3 to 1/2 too pessimistic. --> use better data based on new technologies?
1.3 Grid network restrictions (maximum power which can be fed into the network): depending on location (more rural = usually worse), maximum capacity which can be fed into the network is much lower, dependent on three factors: connecting cable ampacities, voltage range limitation, and transformer power rating. Data on these three factors is proprietary information of the electricity companies. Might be in a range between 0 and 90% restriction on potential
--> data is not openly available. Is there any way we can find a proxy? (especially for CH-wide potential estimate) --> for individuals data might be retrievable from their energy provider for inclusion in calculators (e.g BKW online portal offers the information for individuals for their own place)Calculate potential (economical)
2.1 Consider energy usage in network: network limitations might be less extreme because numbers given are based on no consumption --> unclear how this can be estimated
2.2 effects of everyone having PV installed: excess energy supply at peak times in an area = limitation of the network
Calculate potential (environmental)
3.1 data on energy mix by city is available
Link to Drawing of data structure
Network Limitations
The past generation potential estimates don't seem to take into account the limitations of the network i
- Put CH on Electricity Map
Raise awareness and support global climate goals
Challenge description
Help meet the Paris Convention goals to achieve net 0 by 2050, less than 2 tonnes CO^2 per person! We want to raise awareness around energy use and consumption by putting Switzerland on the map at electricitymap.org and put its open data API to use. (Challenge #11)
28.08.2020 15:04 First solution ideas have been explored and discussed. Beer has been deployed.
28.08.2020 23:00 Despite some hurdles we got everything ready for our idea but realised that it won't be accepted by electricity maps.
29.08.2020 11:00 Complete restart to a much simpler model that will hopefully be accepted by electricity maps and still be better a gray spot on tha map.29.08.2020 13:40 Ideas are tested and documented. However, it's not running live.
- Read your own Smart Meter – Elektrizitätswerke des Kantons Zürich (EKZ)
Lokale Schnittstelle zu Smart Meter inkl. Darstellung auf Web Oberfläche
 Christian Dollfus
 Braulio BarahonaXue WangWim Ton
 Hermann HüniRay NeubauerPeter Zbinden
 Thomas Amberg
 Derrick OswaldHubert Kirrmann
Challenge description
(English below)
#Eigenen Smart Meter auslesen (#3)Ziel
Eigenen Smart Meter durch die lokale Customer Information Interface (CII) Schnittstelle auslesen und Stromverbrauch visualisieren. Dashboard mit den wichtigsten Informationen gestalten.
Idee
Zwei Smart Meter werden vor Ort installiert und werden den Verbrauch von unterschiedlichen Geräten messen. Der Live-Verbrauch wird auf einem web-basierten Dashboard visualisiert. Live-Werte werden mit historischen Daten kombiniert. Am Ende kann das Dashboard einer Person klare Auskunft über die wichtigsten Informationen bezüglich des Stromverbrauchs geben.
##Warum:
In der Schweiz ist es gesetzlich vorgeschrieben, dass alle Smart Meter, die von Energieversorgern installiert werden, eine lokale Schnittstelle (CII) haben, so dass die Kunden Zugriff auf die eigenen Daten haben können. Das schafft mehr Transparenz, da die Kunden ihre eigenen Daten managen können. Innovation wird ermöglicht, weil genaue Daten neu gratis in Echtzeit verfügbar sind.##Data:
Live-Messungen mit Hilfe von Smart Metern
Historische Daten Testanlage EKZ
Eine kurze Einführung zu den Kommunikationsprotokollen der Smart Meters findet man hier: https://icube.ch/DLMSSurvivalKit/dsk1.html
#Read your own Smart Meter
##Goal:
Read your Smart Meter through the local Customer Information Interface (CII) and visualize your consumption. Design a dashboard with the most useful information.Idea:
Two Smart Meters will be installed on-site and will be measuring the consumption of different devices. The live consumption is to be displayed on a web-based dashboard. Live measurements are to be combined with historical data. At the end, the dashboard will be able to display the most important information to an individual about their electricity consumption.
##Why:
In Switzerland, it is prescribed by law that all electricity Smart Meters installed by utilities must have a local interface (CII), so that customers can have access to their own data. Transparency is increased as individuals can manage their own data. Innovation is promoted, as precise data is available for free in real time.See also Challenge 582: "Unleashing the Swiss Smartmeter's CII"
https://hack.opendata.ch/project/582##Data:
Live measurements from Smart Meters
Historical data of an EKZ test site
Short introduction to Smart Meter communication protocols can be found here: https://icube.ch/DLMSSurvivalKit/dsk1.html
Members of the team:
Moritz Bolli
Peter Zbinden
Derrick Oswald
Hubert Kirrmann
Hermann Hueni
Angelos Selviaridis
Christos Konstantinopoulos28.08.2020 14:34
The team will focus on moving data from the metering system and visualizing the data graphically.
It will not rewrite the existing proprietary components.28.08.2020 14:38
A quick prototype system has been constructed.
There is a MQTT broker installed on the Raspberry Pi.
It is fed by a bash script that monitors the log file of the proprietary software and publishes on four topics at roughly 5 second intervals:smart_meter_events/raw sends messages containing the text of each new line in the proprietary software CSV file
smart_meter_events/voltage sends a time stamp and the voltage
smart_meter_events/pf sends a time stamp and the power factor
smart_meter_events/power sends a time stamp and the power
MQTT clients, for example on members laptops, subscribe to the above topics and reports the messages as they are received.
Graphing software has been prototypes to display the time series (sample data).28.08.2020 14:42
OpenHUB 2 has been installed, and still being worked on, but as yet not successful.
28.08.2020 14:53
Initial success in reading the data and transferring it to a PC has been demonstrated.
28.08.2020 14:55
Smart meter readings are saved to the InfluxDB database by a MQTT <=> InfluxDB bridge python script.
28.08.2020 17:35
The first successful dashboard has been created with Grafana.
28.08.2020 18:18
Presented at Open Energy Data Hack Days - Saturday, 29 August, 2020
01.09.2020 05:58
Source code is available, per the Source link.
01.09.2020 06:00
- Smart Meter Anomaly Detection – CLEMAP
Challenge #14: "Anomaly Detection for Smart Meter Devices" from the open energy hackdays 2020
Challenge description
Demo: https://meteros.staging.akenza.io/
28.08.2020 12:54
Project scope has been defined and work has been started28.08.2020 19:54
We have deployed a very first version to a k8s cluster which can be viewed here: https://meteros.staging.akenza.io/The backend still needs some work though, the frontend does not query the data from the backend yet
28.08.2020 23:25
We drafted definitions of anomalies (human definitions) and meter data is sent to the cloud where it is processed and stored along with various improvements to the UI. The current state can be checked at the project link.The API and online processing of the data (live detection of anomalies) is still to be implemented.
29.08.2020 12:38
The last finishing touches are being applied. Forecasts have been removed from scope due to time restrictions. - Smart Meters: New Uses – Hochschule Luzern, Fachhochschule Nordwestschweiz
Challenge description
(English below)
##Neue Nutzungsfelder Smart Meter Daten (Challenge #7)Entwickeln Sie eine neue Visualisierung aus Smart Meter daten, die interessant für Endnutzer sein könnte (beispielsweise einen Energiepreis für tiefen Verbrauch, der auf die Lebensumstände des Nutzenden Rücksicht nimmt oder die Aufschlüsselung der unterschiedlichen Geräte, Nutzungsanalyse für Renovation oder PV Installation, etc.)
Alternativ: Entwickeln Sie einen Prototypen für einen Algorithmus um die Ausgangsdaten für die obige Visualisierung aus Smart Meter Daten extrahieren zu können.
New applications for smart meter data
Showcase new uses for the Smart Meter, for example a visualization that could be interesting to an end user (e.g. awards for low consumption in respect of the user’s specific situation, disaggregation into different appliances, suitability of PV installation or retrofitting, etc.)
Alternatively: Develop a prototype for an algorithm providing the input data of the above visualisation
Example see Challenge 582: "Unleashing the Swiss Smartmeter's CII"
https://hack.opendata.ch/project/582 - Unleashing the Swiss Smartmeter's CII
Empower citizens to use their energy data. Using the smartmeter's CII beyond visualisation to steer local consumption.
Challenge description
Introduction
Swiss law (StromVV Art 8a) requires all installed smartmeters to offer a local "consumer information interface" (CII) to provide all measured data at the moment of its recording. Despite 2+ years since this has become mandatory by the end of 2017 it is still very hard to obtain sufficient information from the DSO (distribution system operator) on the particular CII put in place on the installed smartmeter.
Different technical interfaces (CII) are in use on various smartmeters in Switzerland which inhibits interoperability for innovative solutions. It is almost impossible to find publicly available information on what kind of CII is offered by the 600+ different DSO of Switzerland.
Where as in the netherlands, the energy sector organisation (netbeheernederland.nl similar to VSE in Switzerland) has required all smartmeters installed during the past years already to offer the same well designed CII called DSMR P1 (also adopted by Belgium and Luxembourg), the swiss authorities or the market participants have regrettably not decided on a mandatory standard to be required. This unfortunate situation has inhibited the market in Switzerland for innvovative applications. And a large amount of money and ressources is currently spent (and are finally wasted) by installing additional private energy meters behind the DSO's smartmeter.
See also [D]: https://forume.ch/t/kundenschnittstelle-der-intelligenten-messsysteme/938/4
Let's try to improve on that.
Motivation
One motivation to use the CII beyond visualisation might come from the following problem definition:
Photovoltaic systems (PVS) with an output of 5-15 kW are increasingly being installed on roofs of swiss houses. Often there is a 300 L electric boiler connected on 3 phases of 400 V with a power of 6 kW for the hot water demand, which is charged during the night via a ripple control of the DSO. Because Art 8c of the StromVV has obliged the DSOs since 2018 to remunerate the customer for such flexibility useful to the grid, some DSOs remove the ripple control when connecting a new PVS to the grid and at the same time installing a smartmeter.
If energy is permanently supplied to the electric boiler, around 30-50% of the annually required heating energy of approx. 3.8 MWh/a [1] can already be used from the PVS production. By means of an electronic control system, an additional max. of 40% of the grid supply could be substituted trough PVS production. With a tariff difference between the feed-in tariff and grid procurement of approx. 100 Fr/MWh, savings of only 150 Fr per year would result.
For an economic solution, the costs for the necessary power control (including installation) should not exceed a few 100 Fr. However, many products available today [2] quickly require investment costs of 1'000 - 3'000 Fr which is far beyond any efficient and economically justifiable solution.
[1] https://www.energie-lexikon.info/warmwasser.html [2] Example: (a) Energy4me units 1'083 Fr [ control unit 377 Fr, switching power supply 39 Fr, AC meter 248 Fr, thyristor controller 280 Fr, mains filter 139 Fr ] Q:https://www.energy4me.ch/energiemanagement/ (b) Expenses for electricians for installations: 500-1'000 Fr.Goals & tasks
Together we shall discuss and demonstrate how easy and cost-efficient a simple solution to this scenario can be put in place using DSMR-P1 with an ESP Microcontroller and a piece of open-source software coupled with a very affordable wifi-enabled powerswitch-actor. Attaching any of the various visualisation- or energymanagement-sytems (EMS) for home automation over MQTT might then be relatively straight-forward.
But the key challenge is how to deal with the diversity of CII such that all citizens may get easy and efficient access to their own owned energy data. Many additional questions still have to be worked on. We hope that we may tackle some of these together with the expertise of those supporting this challenge.29.08.2020 07:19
We developed a concept and PoC roadmap to provide a "universal" adapter from smart meters to home IoT platforms, see "Source" for details.












Programme
Friday, 28 August
- 09:30
Reception with coffee and croissants
- 10:00
- –11:00
Challenge pitches
Optimization of District Heating · PV Optimisation · Read your own Smart Meter · Cheapest Charging Around · E-Mobility Behavior Analysis · Energy data visualization · Smart Meters: New Uses · ML Wind Power-Prediction · Performance GAP Buildings · Photovoltaic: Where is it Best? · Put CH on Electricity Map · Integrations for North App · Distributed analytics for asset management · Anomaly Detection in Smart Meter Data
- 11:00
Forming teams
2 to 8 people per team.
- 11:30
Start of hacking
- 13:30
- 19:00
Dinner, then hacking (open end)




Saturday, 29 August
- 08:00
Breakfast and teams continue
- 14:00
Time is up: document the projects on hack.opendata.ch
- 15:00–16:00
Final presentations and discussion
Optimization of District Heating · PV self-consumption optimization · Read your own Smart Meter · Cheapest Charging Around · Energy data visualization · E-Mobility Behavior Analysis · Empower the People with Smart Meter Data · ML Wind Power-Prediction · Put CH on Electricity Map · Distributed analytics for asset management · Anomaly Detection in Smart Meter Data · Smart Meter Anomaly Detection (MeterOS) · Unleashing the Swiss Smartmeter’s CII
- 16:00
Closing and apéro
Read the original announcement
The Open Energy Data Hackdays 2020 took place
the 28th and 29th of August 2020 in Brugg!
Happy and fully fledged, with all of the planned challenges, fine food
and nice people the way we like it!
Many thanks to all the participants, sponsors and supports!
We were impressed by the high skills brought together by a group of 80 people on site plus 7 people working remotely.
Their proposals for the ambitious challenges were nonetheless ambitious and convincing as you can see for yourself:
See the challenges here: Challenge presentations (from min 37)
and the projects after two days of intense work: project presentations 1/2 (at 2h17m ) and here: project presentations 2/2
Each of the projects are documented specifically on our hack platform hack.opendata.ch

We are also very happy that the Hackdays were the occasion for Campus 21 to harvest the visions of some of the experts present for the future of Open Energy Data:
.
Keep tuned for the Energy Data Hackdays 2021 and our other hackathons by signing up to our newsletter or checking our projects page.
Looking forward to meeting you!
.
.
.
.
That’s how we announced the event in 2020:
Do you want to work towards a sustainable future?
Become part of our Energy Data Hackdays and
develop new solutions in interdisciplinary teams within 32 hours!
Where: Hightech Zentrum Aargau in Brugg
When: 28 – 29 August 2020
The 13 solutions developed last year prove that open Hackdays can make a valuable contribution to energy efficiency and to our understanding of energy. Let’s build on these results and use energy data to create a sustainable energy future. Welcome are all kinds of skills and perspectives: students*, data analysts*, designers*, programmers*, experts* and many more!
“Collaboration and open data are the fundamental conditions for implementing the Energy Strategy 2050” Martin Hertach, Federal Office of Energy
Why energy data?
How can I participate?
What’s the Plan?
Why should I participate?
What are the project ideas & datasets?
Frequently Asked Questions
Organization and Sponsorship
Why energy data?
Digitalization, which has already fundamentally changed many industries in recent years, is only just beginning in the energy industry. We want to exploit this potential!
Energy companies and public infrastructure operators are generating large amounts of data that are only partially used or not used at all. A better use of idle data for new services and analyses is in the interest of these companies and their customers, but above all in the interest of society. Within the framework of the Energy Data Hackdays, energy companies, public administrations and other organisations related to the energy industry provide data for the development of creative ideas and initial prototypes.
How can I participate?
The Energy Data Hackdays are open to any interested person. Our goal is to bring together interdisciplinary teams in which software developers, designers, scientists, analysts and ideators work together to develop new solutions.
If you would like to become a partner of this event as an energy data supplier or as challenge partner, please contact us at info@opendata.ch.
What’s the plan?
Friday, August 28th 2020
09:30 Reception
10:00 Presentations of project ideas & challenges
11:00 Team composition
11:30 Collaborative project development
Saturday, August 29th, 2020
15:00 Final presentation of the results
Followed by a farewell drink
The event will take place at the Hightech Zentrum Aargau, Badenerstrasse 13, 5200 Brugg. Catering will be provided. Sofas and a few air mattresses will also be available for those who want to work through the night.
Why should I participate?
The exciting challenges are what motivated me most. I felt that i’ll have the chance to be creative and to meet people from other branches and points of view. And so it was. Reaching for a meaningful goal, the interdisciplinary exchange and the super spirit – it totally fulfilled my expectations!
– Expand your network with diverse contacts from the scene
– Work with like-minded people on a project idea that is close to your purpose
– Learn more about new developments in the energy sector
– Be part of the energy revolution against climate change
– Present a project idea and motivate the experts to develop it further with you
– Perhaps get support for further development of your project
* We are very much encouraging women to take part: it would be a pity to miss out on your valuable insights.
Project ideas & data
Instead of the event previously planned in March, we were able to hold an online mini “Pre-Energy Hackdays 2020” where around 20 people at time took part. A few of the challenges were pitched and the teams came up with first drafts and data analyses that should serve the next literacy of the projects.
You will find here an overview of the challenges already submitted and you can have a look at the projects that were started in March. Here are the 13 solutions of the last year.
You can also find here the various open energy data sets that we have released, collected and processed for the Hackdays until now.
Frequently Asked Questions
How much does my participation to the Hackdays costs?
The Hackdays are free thanks to our sponsors and partners.
Food (including breakfast), electricity/ basic workplace infrastructure and internet are also provided.
Do I need a project idea or a team to participate?
No, this is possible, but not necessary. At the beginning of the hackathon different project ideas and challenges will be presented. You can work on the project idea that inspires you the most.
Are the Hackdays only for developers?
No, the Hackdays are not only aimed at developers*, but also at designers*, energy specialists*, journalists*, lateral thinkers* & makers*. You can register here.
Do I have to stay on site for 32 hours?
No, that’s not necessary either. It is important that you contribute to the success of your chosen project and discuss with your team when and where you work.
What is the official language?
English! In the groups, feel free to adapt to your preferences.
What do I need to bring along?
Most important: don’t forget your laptop. You may also want to bring your notebook, pens and possibly a sleeping bag. However, we will provide you with a basic supply of material, such as papers, flipcharts, post-it, food and drinks.
What happens afterwards?
We aim to achieve a long-term and sustainable impact with the Hackdays projects being created. Accordingly, the partner organisations are happy to continue to support and promote promising projects and results the best they can.
The discussion about energy also goes on within the Energy Data Working Group. Have a look!
The Hackdays results remain in the possession of the team
We abide by the hackcodeofconduct.org
Organization & Sponsorship
The Energy Data Hackdays is an initiative of the Zukunftsregion Argovia, the *Hightech Zentrum Aargau* and the Swiss association Opendata.ch.
The Hackdays are made possible by:
*AEW Energie AG*, *Elektrizitätswerke des Kantons Zürich*, *Kanton Aargau*, *Bundesamt für Energie*, Bundesamt für Statistik, Road to Bern, SEP Swiss Energy Planning, Kickstart, Akenza, Energy Startup Days, BEN Energy, Tomorrow, geoProRegio
and our partner Research Institutes:
*ESC/ETH*, Paul Scherrer Institut, ** FHNW*, * HSLU
If you would also like to support the event as an energy data supplier or as a financial or communication partner, please contact us at info@opendata.ch.
Organising team
 Maud ChâteletProjektleitung und Moderation, Opendata.ch
 Oleg LavrovskyDaten, Plattform und Livestream, Opendata.ch
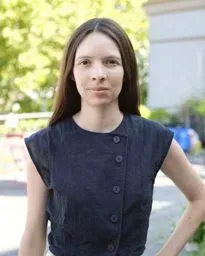 Nikki BöhlerGeschäftsführerin, Opendata.ch
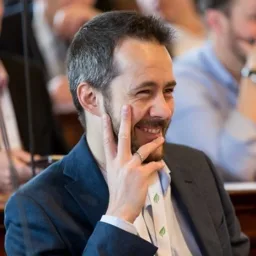 Matthias EifertProjektleitung und Moderation, Zukunftsregion Argovia
 Peter MorfHightech Zentrum Aargau
 Nadine ZielinskiFotos, Hightech Zentrum Aargau
Host

Supported by


- Road to Bern


- Tomorrow


