‘School Grade Transition Rates’ & 9 other projects from the Data Hackdays Bern
- Hackathon
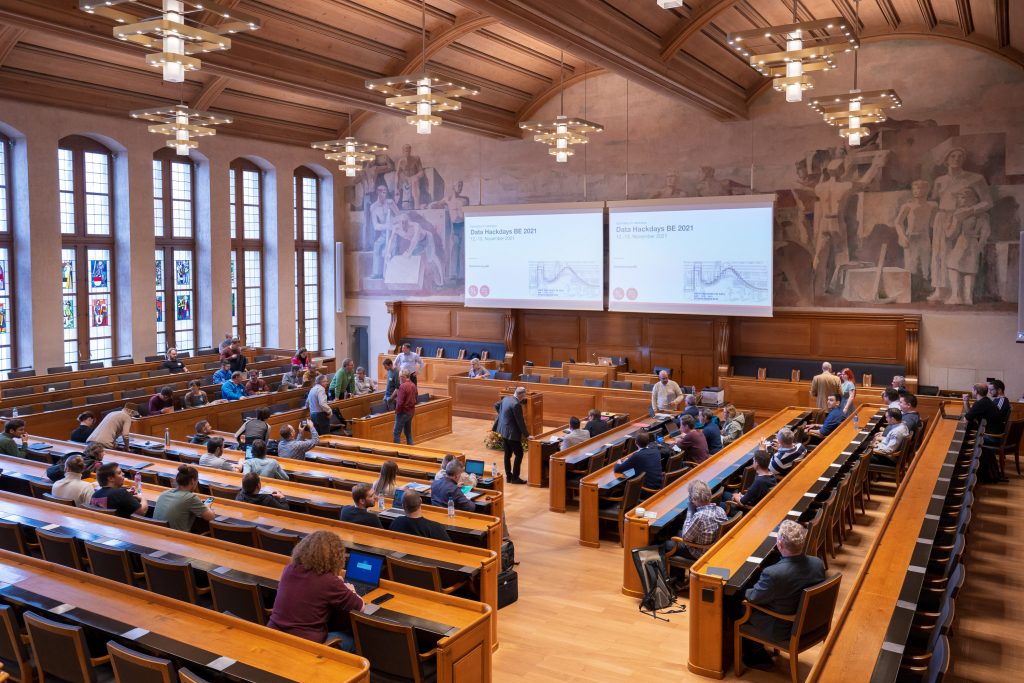
November 12th-13th marked the premiere of the Data Hackdays BE! At these hackdays, a total of 75 participants gathered in the town hall in Bern to work on 10 exciting challenges. All of the challenges were relevant to the cantonal administration in Bern, ranging from Covid-19 vaccine analyses to public transportation and local school data analyses. The opening and closing sessions took place in the cantonal administration’s meeting chamber, whereas most of the hacking was done in different rooms all over the majestic town hall.
A big thank you to all the participants for your amazing contributions!
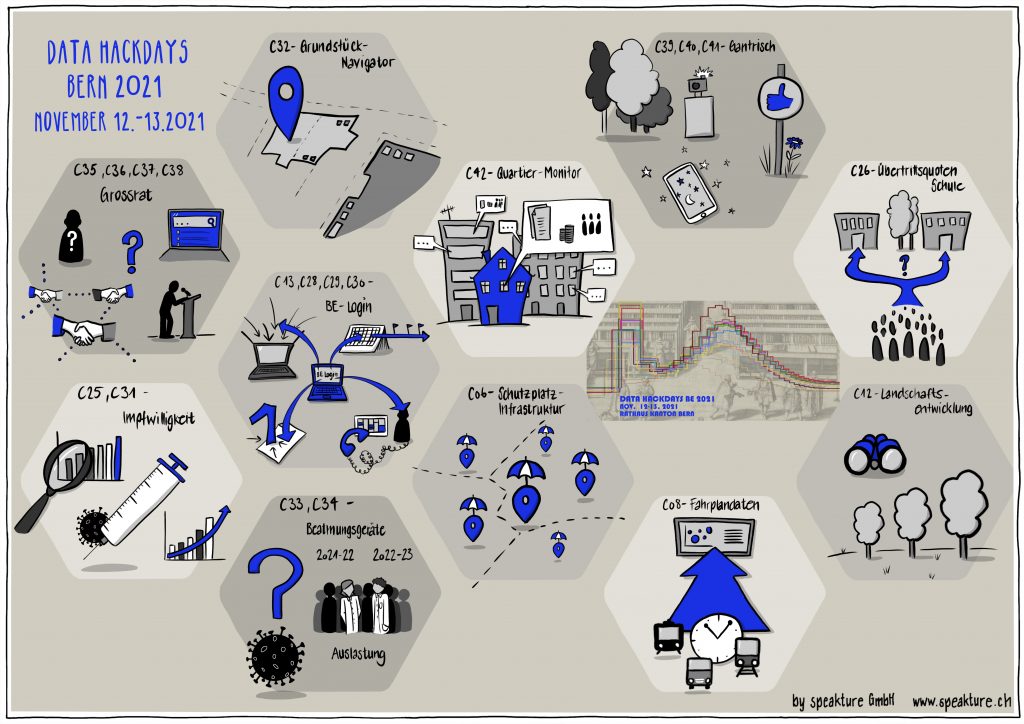
Below you can find a short summary of each of the challenges. Feel free to click on the link for further details as well as their documentation & source code.
Optimizing Shelter Infrastructure
How can we optimally organise shelter infrastructure, such that in case of an emergency, there is enough capacity in the necessary regions? The current shelter infrastructure is outdated. Thus, this group analysed data to find the optimal locations where new shelters should be built (e.g. based on population density and existing shelter capacity).
Public Transportation Schedule
For this challenge the group created a plan on how to visualise public transportation data based on specific bus or tram stops.
Cantonal Personal Data Navigator
What data does the cantonal administration have on me? In order to give citizens an overview of their personal data, this group built a prototype that allows users to navigate their data based on specific categories (e.g. health, finances, mobility etc.). The vision is that users can easily (automatically) share this data with other businesses from a single source (“once-only principle”).
School Grade Transition Rates
This group created a visualisation of the rates at which children enter middle & high school in different municipalities across the canton of Bern. The data can be filtered based on gender and the language of instruction.
My Open Data
The aim of this challenge was to create a personalised and user-friendly dashboard to access various open data sets that one may be interested in. Their mockup dashboard included demographic and political data that the user could filter based on their interests.
Understanding COVID-19 Vaccination Willingness
What can be discovered about vaccine willingness based on demographic data? After signing a confidentiality agreement, this group was allowed to work with anonymised vaccine data. There were various results such as visualising vaccine rates across the canton of Bern, correlations (not causations) between political party association and vaccine rates, as well as a detailed timeline of when citizens registered and later received their vaccine.
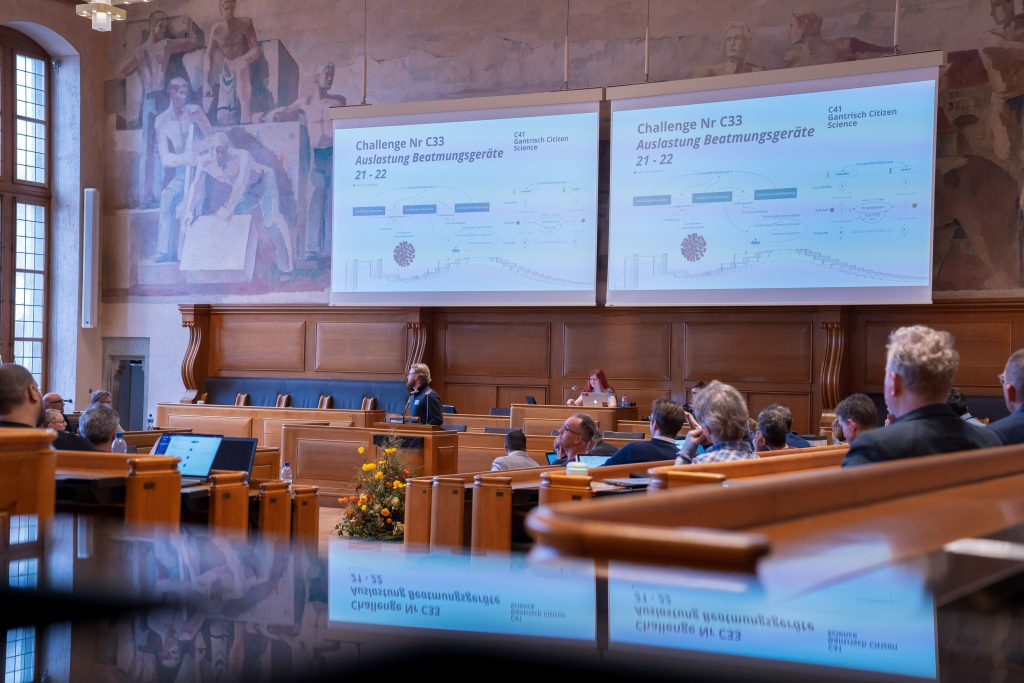
Ventilator Capacity Analysis
By analysing various Covid-19 data, the aim of this challenge was to be able to predict hospital ventilator capacity. Based on their analysis, the group came up with a rough model of how one could predict this capacity.
Political Challenges
This group combined various interrelated political challenges, which mainly focused on increasing transparency of the Cantonal Grand Council – Who are the members? What are their ambitions? What are they effectively doing? However, the data that was necessary to answer these questions was extremely difficult to work with. Thus, the group came up with a system to sort the data so future teams can work with the data more easily.
Gantrisch Night Sky Quality
The Gantrisch Nature Park is the only region in Switzerland that is part of the Dark Sky initiative. The aim of this group was to present the data from the Sky Quality Meter app, which can be used to measure the night sky brightness, in a user-friendly way. This would help stargazers know the best locations from which to observe the night sky.
Neighbourhood Monitoring
This group successfully created a prototype map on the dufour platform on which they aggregated data sets about building property areas with registry data and tax data. This gives various stakeholders the ability to get deeper demographic insights of the different neighbourhoods in a given city or region.