Energy Data Hackdays 2023
- Hackathon
15.–16. September 2023, 09:00 @ FHNW Campus Brugg-Windisch, Bahnhofstrasse 6, 5210 Windisch
Veranstaltet von Opendata.ch, Hightech Zentrum Aargau AG, Hochschule Luzern
Die fünften Energy Data Hackdays fanden am 15. und 16. September 2023 erstmals an der FHNW in Brugg-Windisch statt, organisiert vom Hightech Zentrum Aargau, Opendata.ch und der Hochschule Luzern. Über 160 Anmeldungen und mehr als 30 Partner aus Hochschulen, Energieunternehmen, Dienstleistern und Industrie: Gemeinsam entwickelten die Teams Ideen und Prototypen zu Challenges der Energiewende, die anschliessend in den Organisationen weiterentwickelt werden sollen, die sie eingereicht haben. Im Juni ging ein Pre-Workshop im Technopark Aargau voraus.
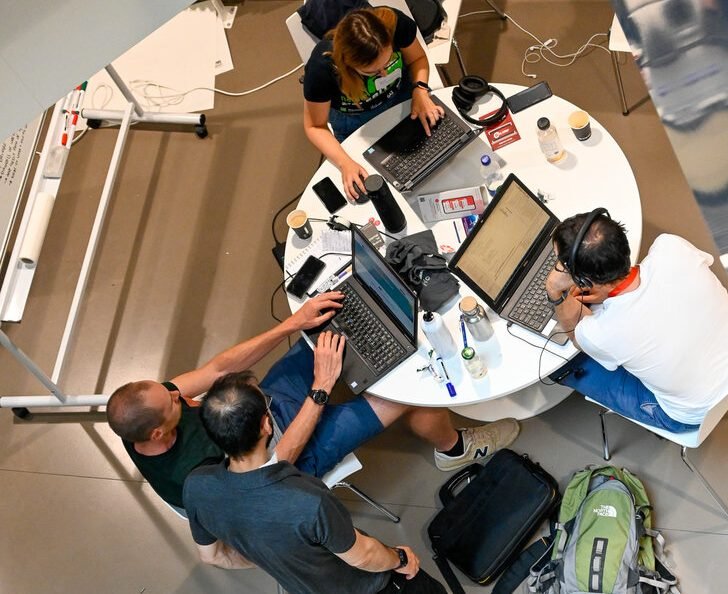
Fotos
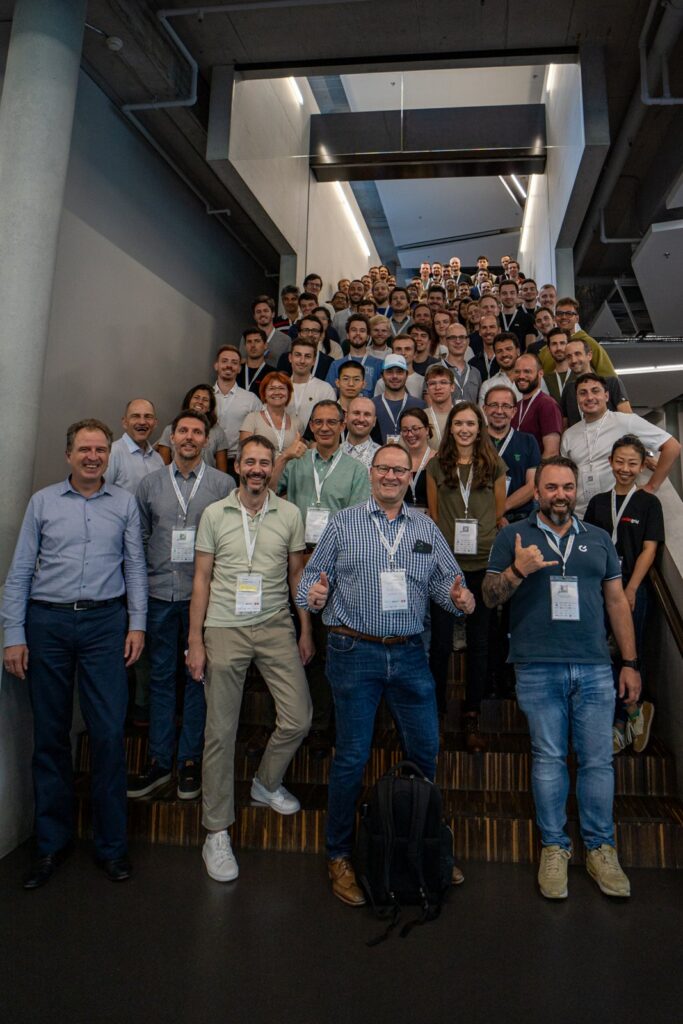
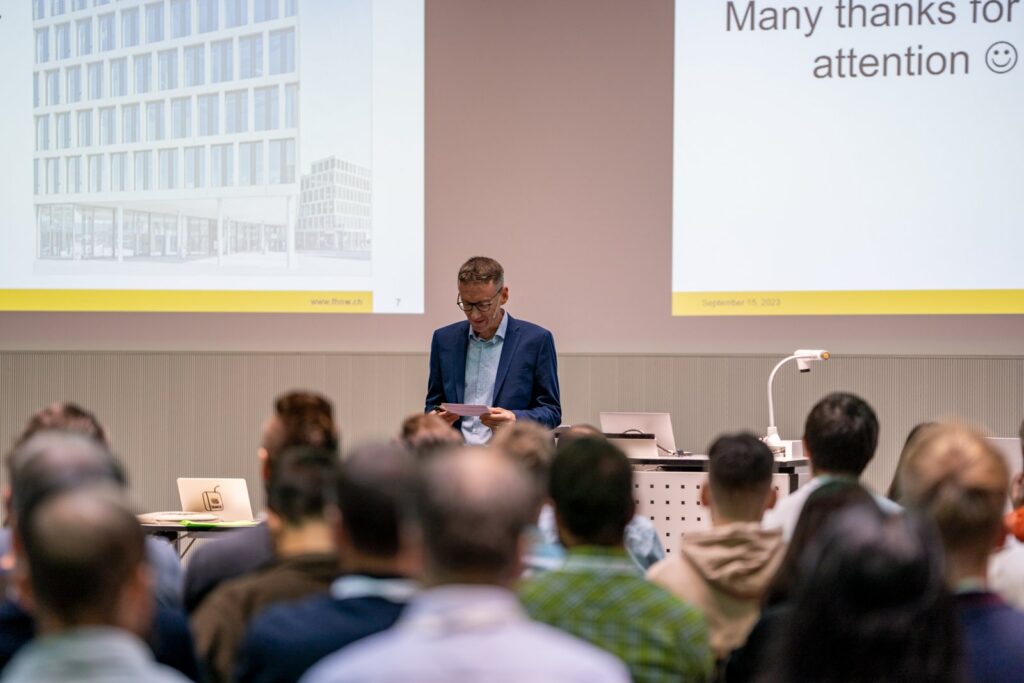
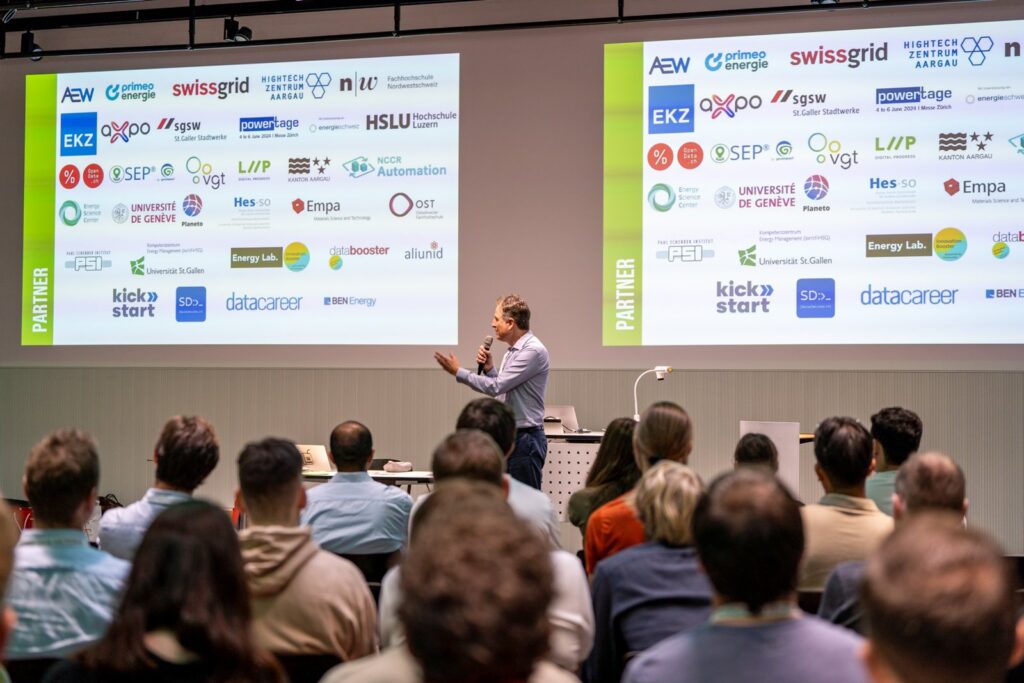
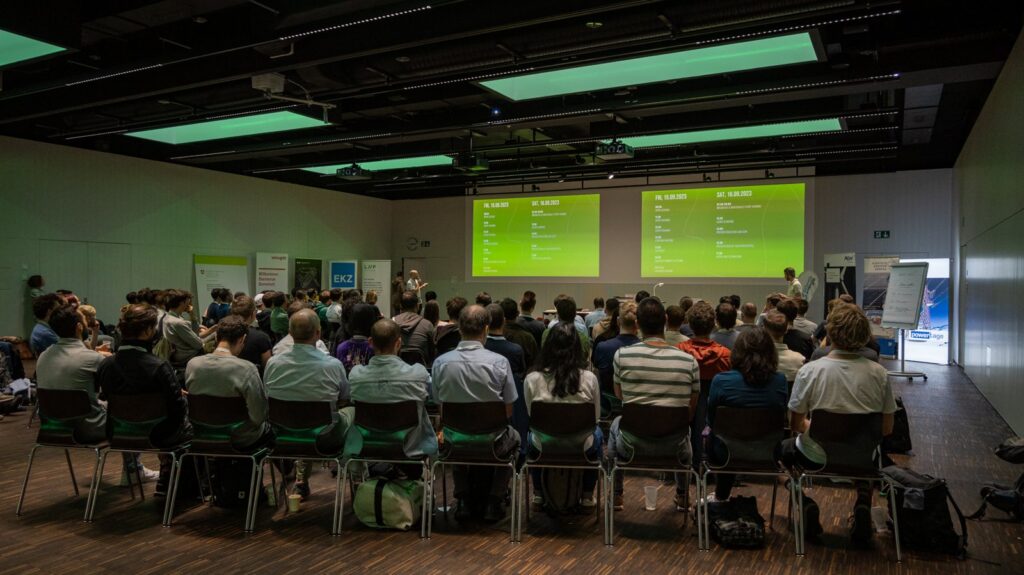
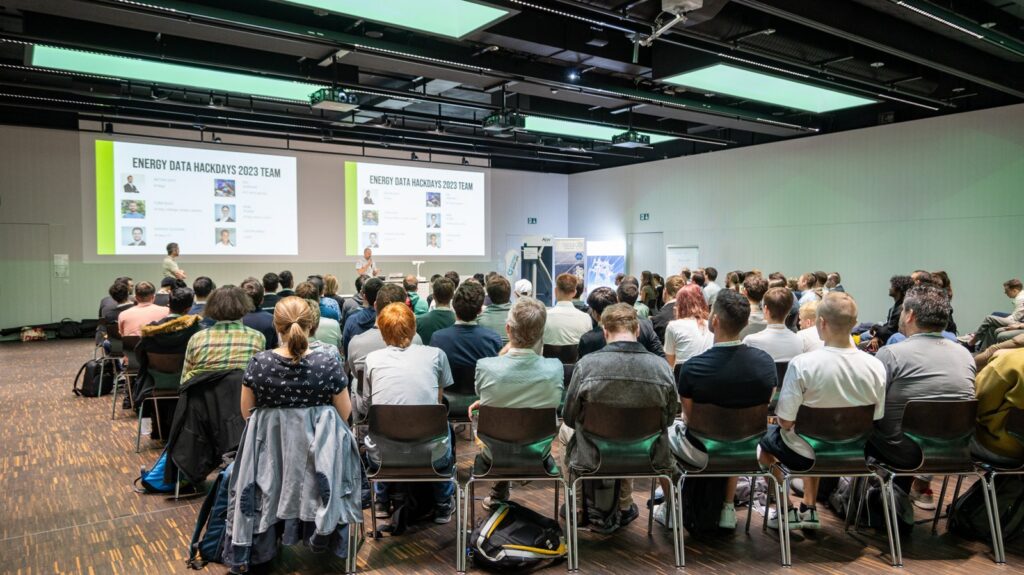
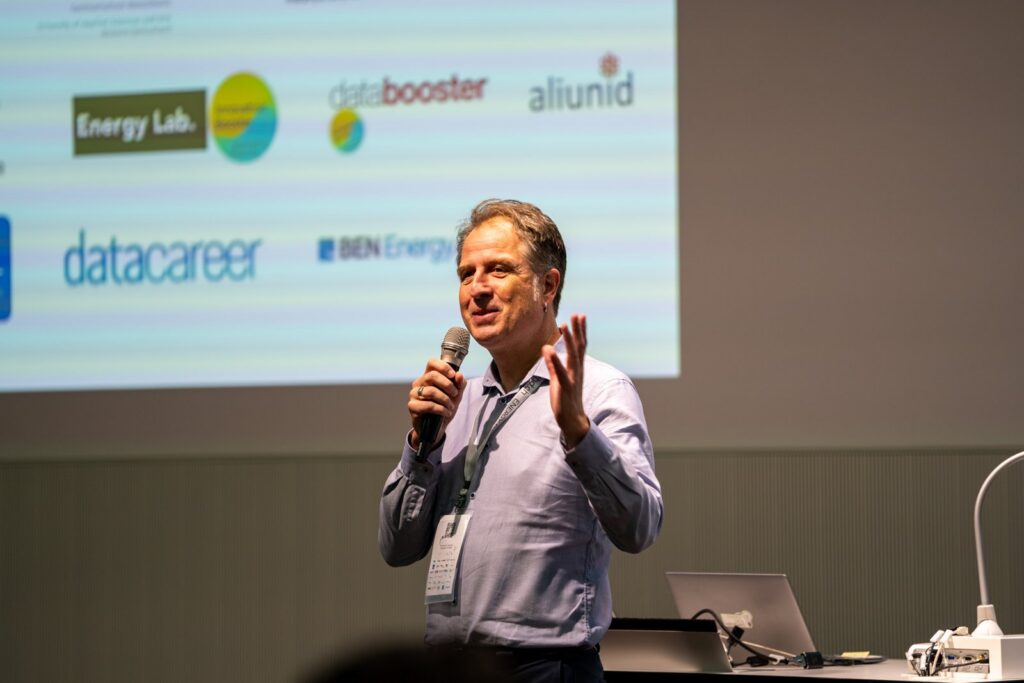
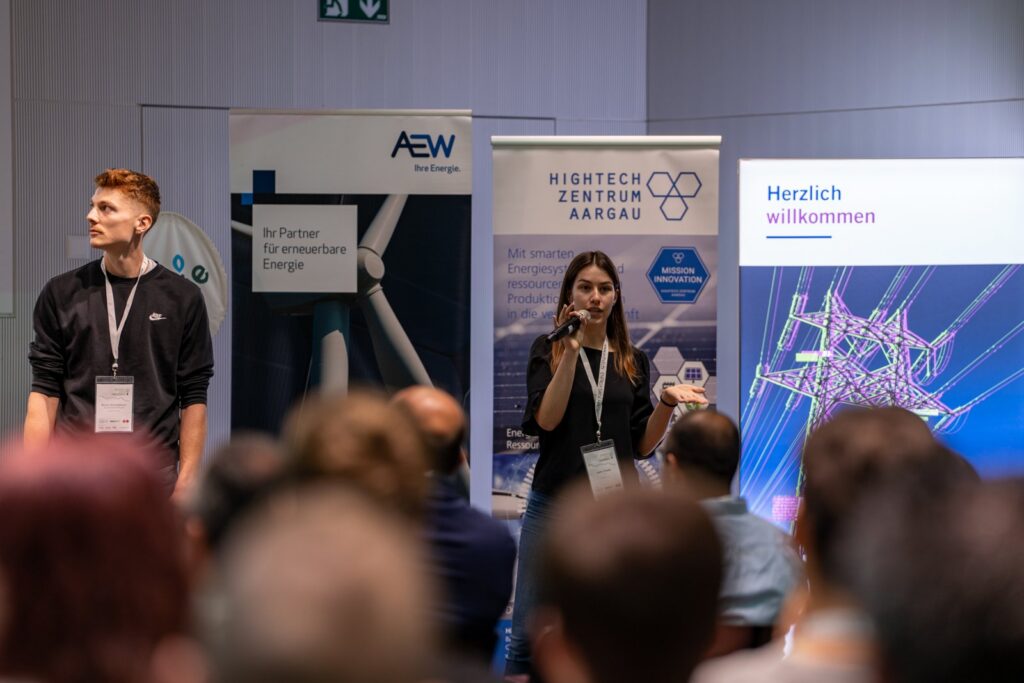
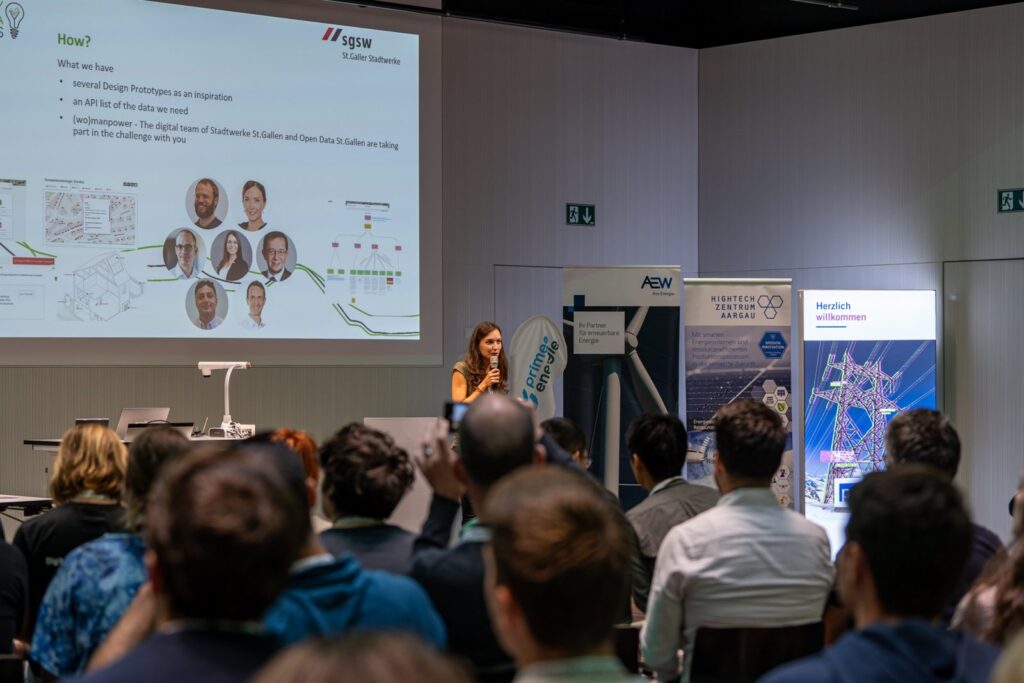
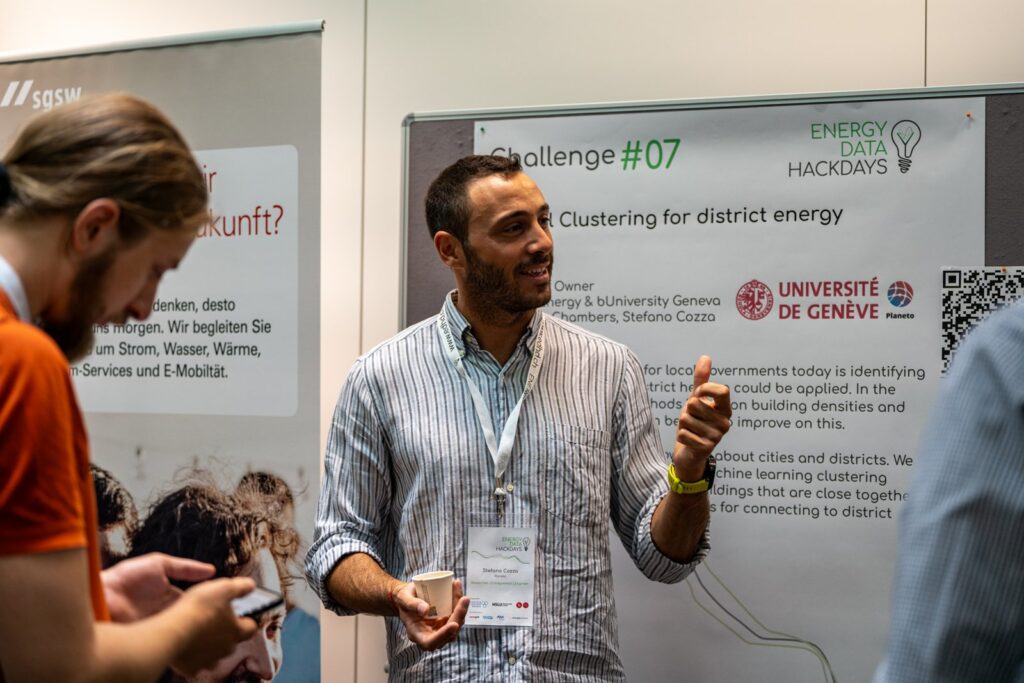
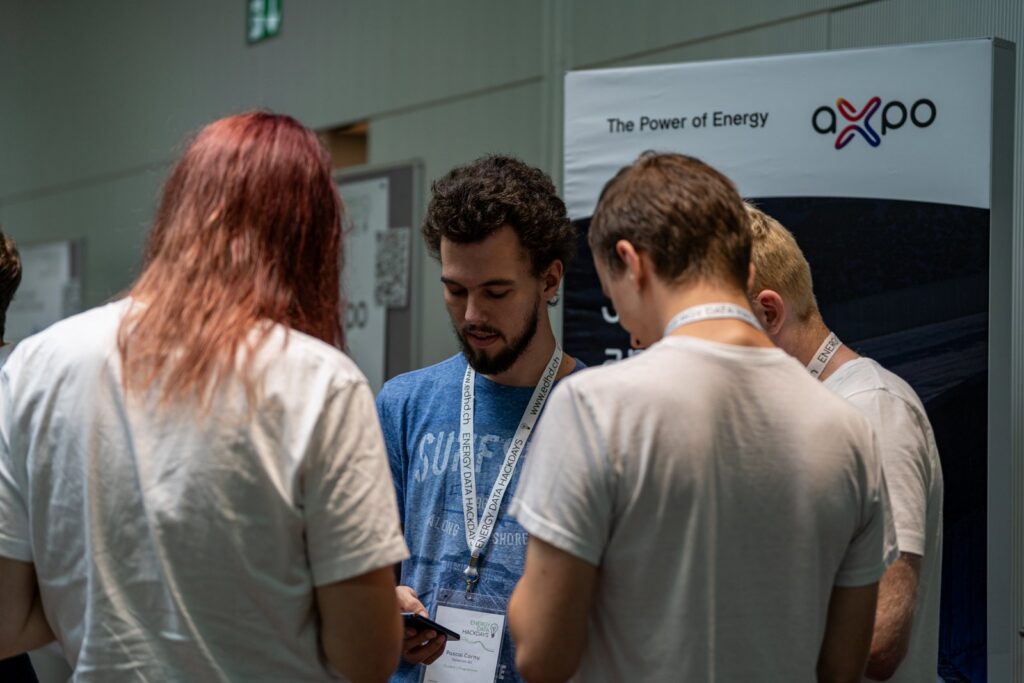
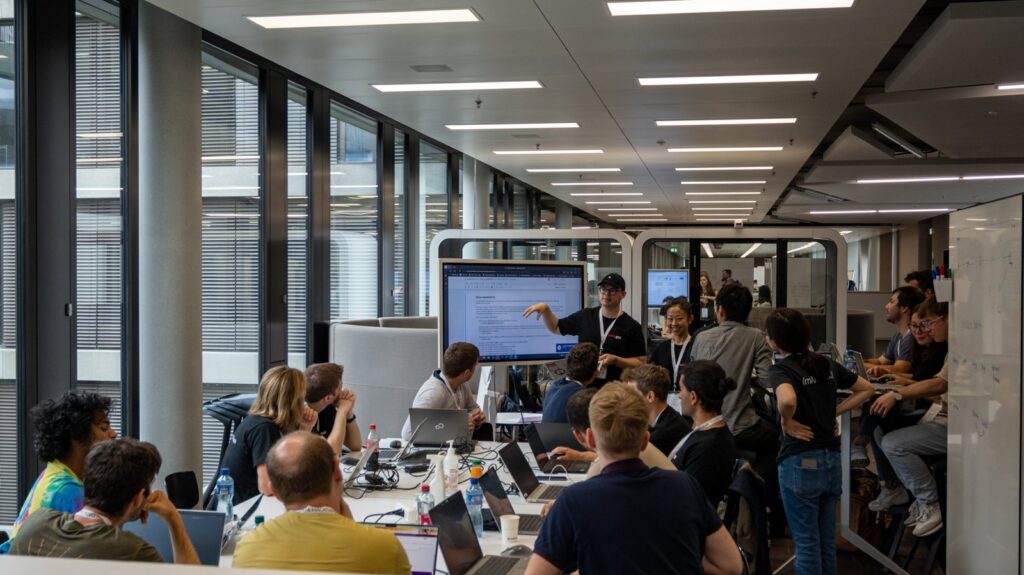
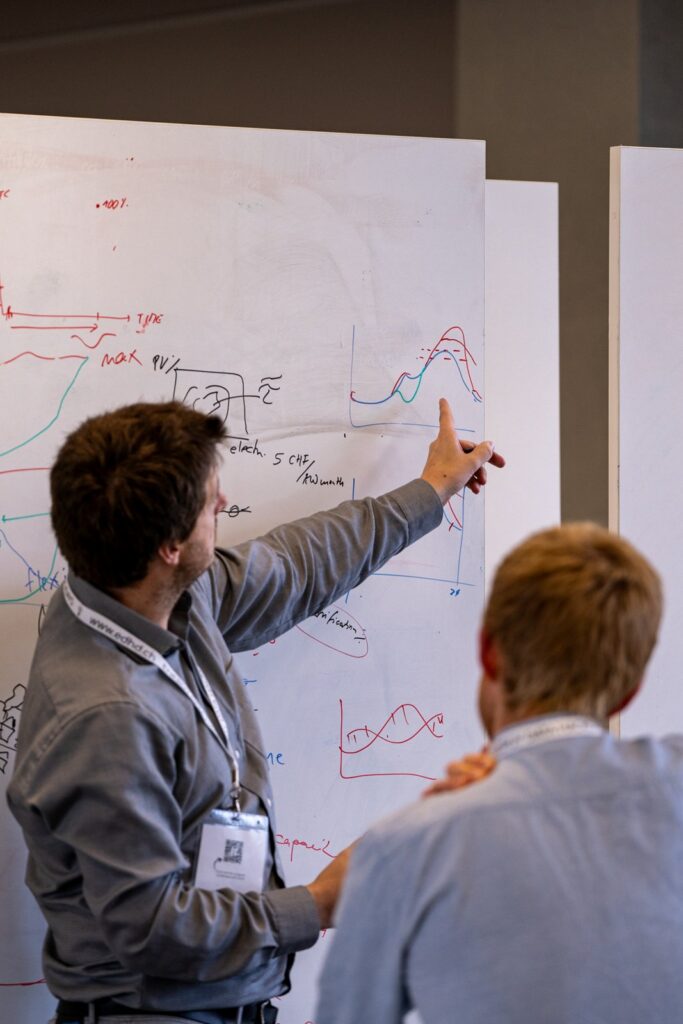
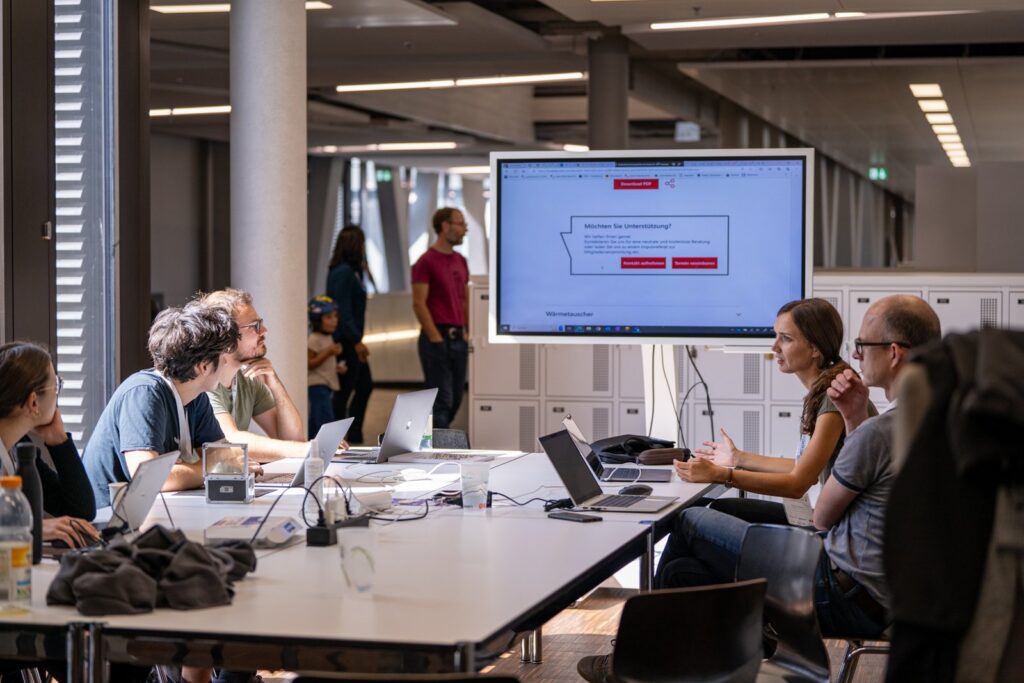
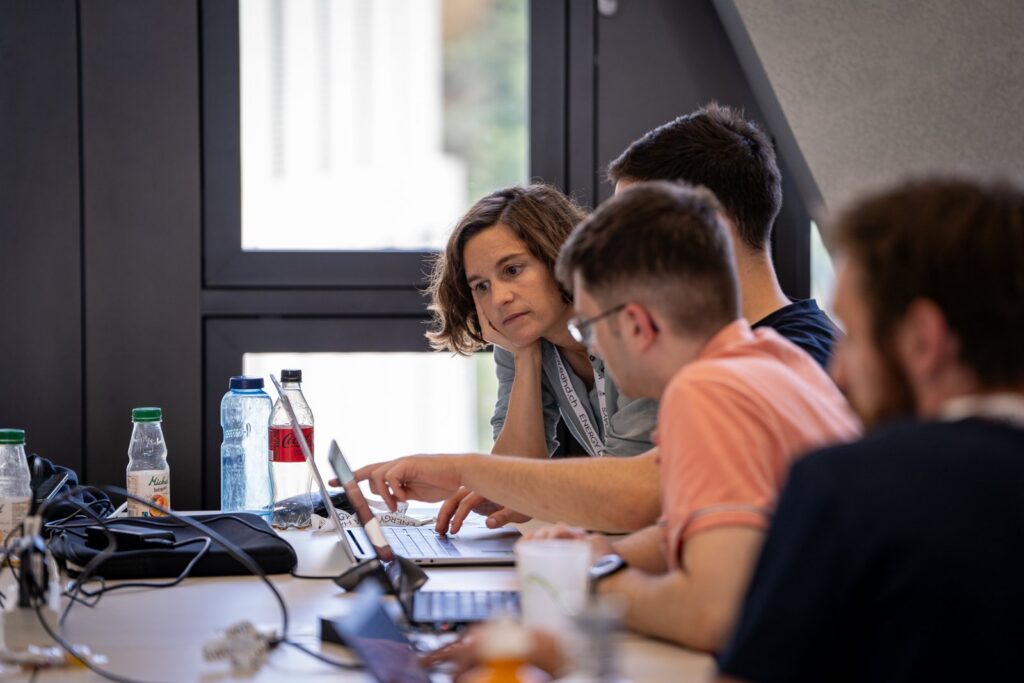
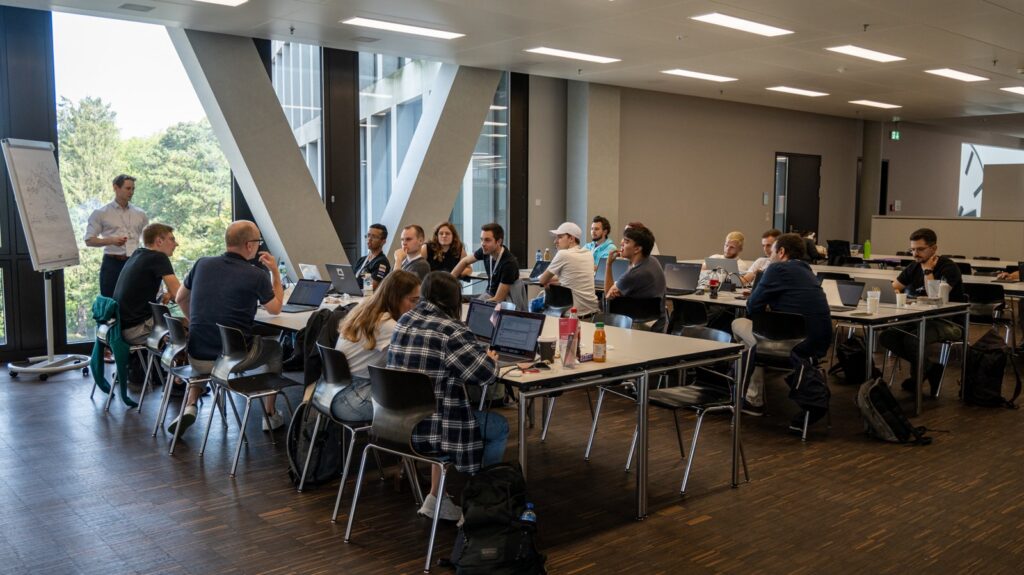
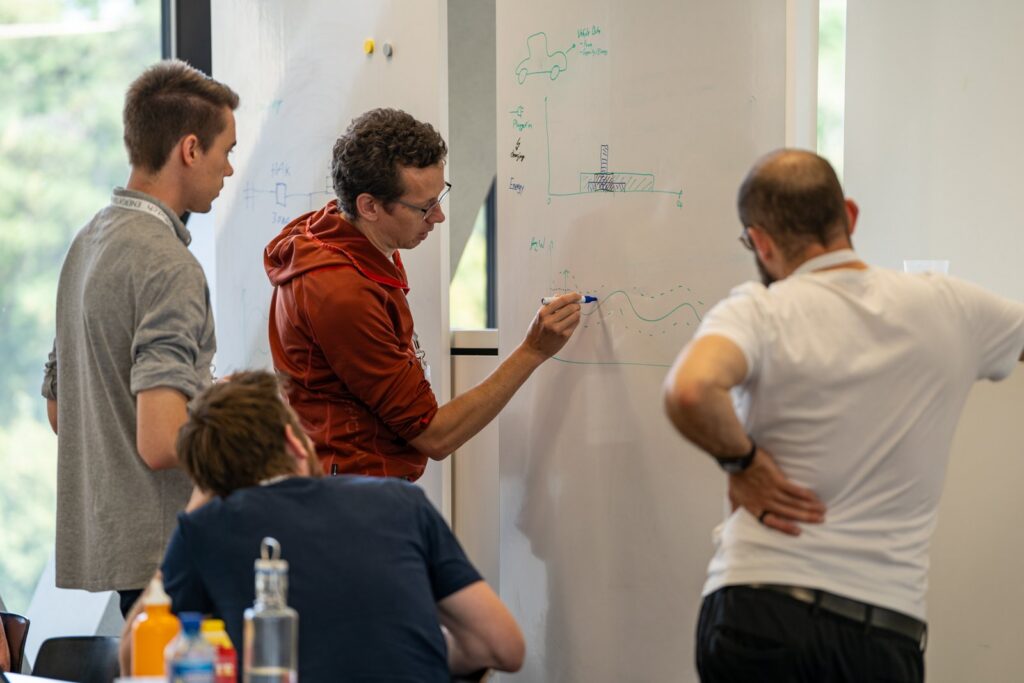
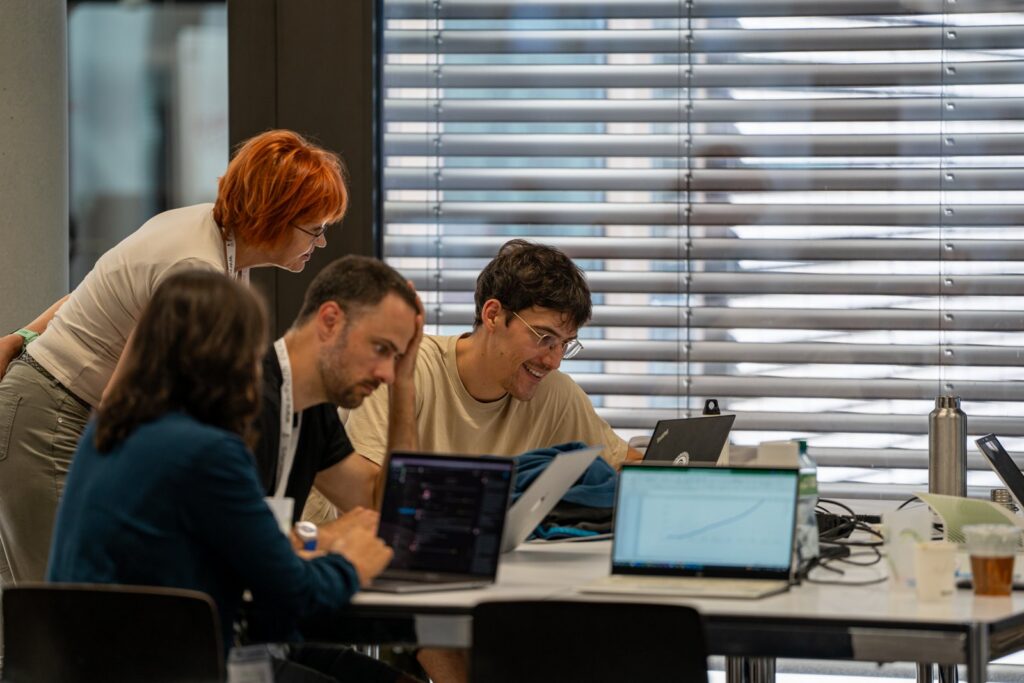
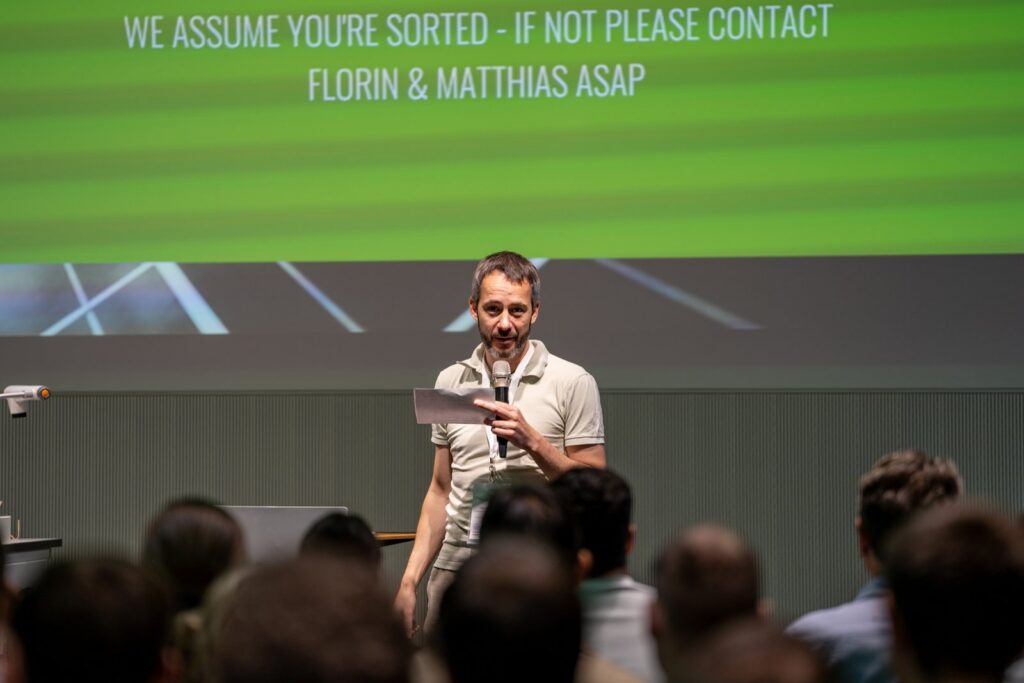
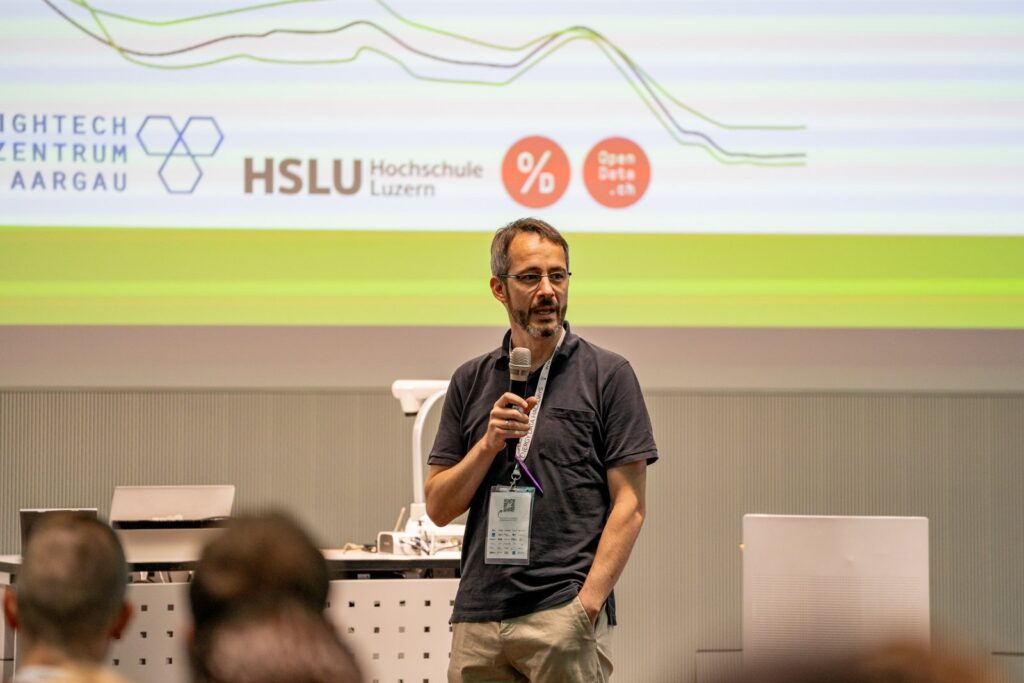
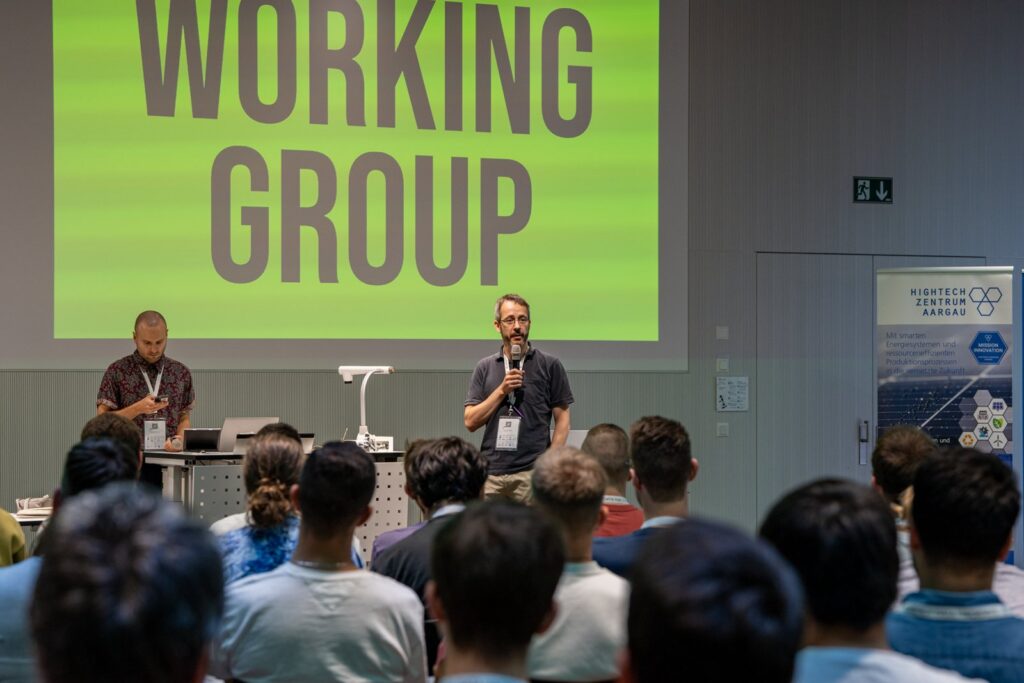
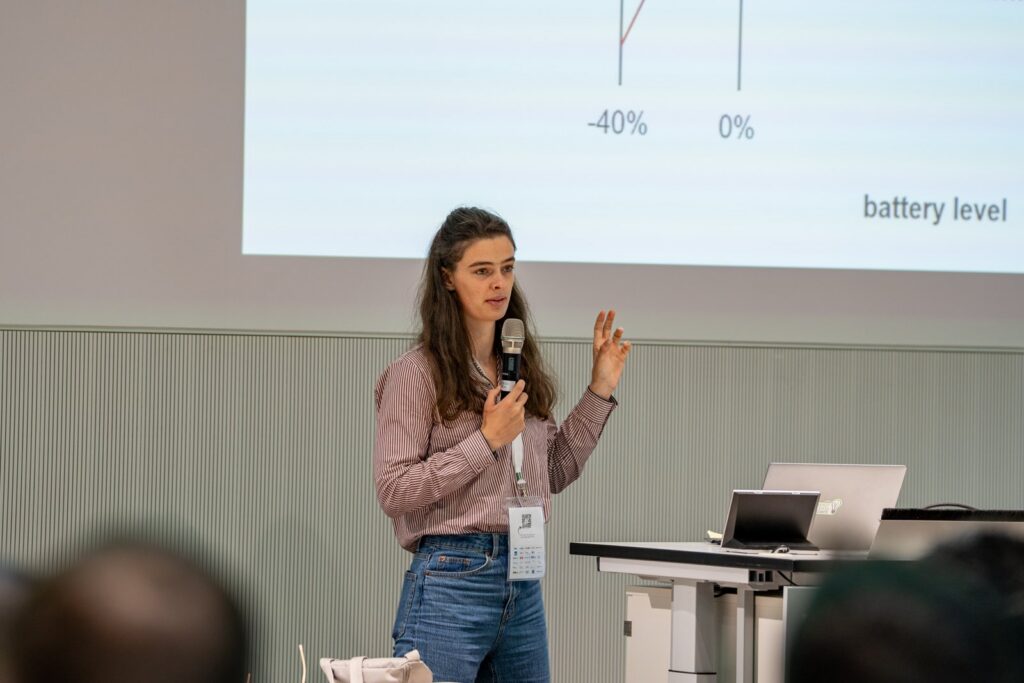
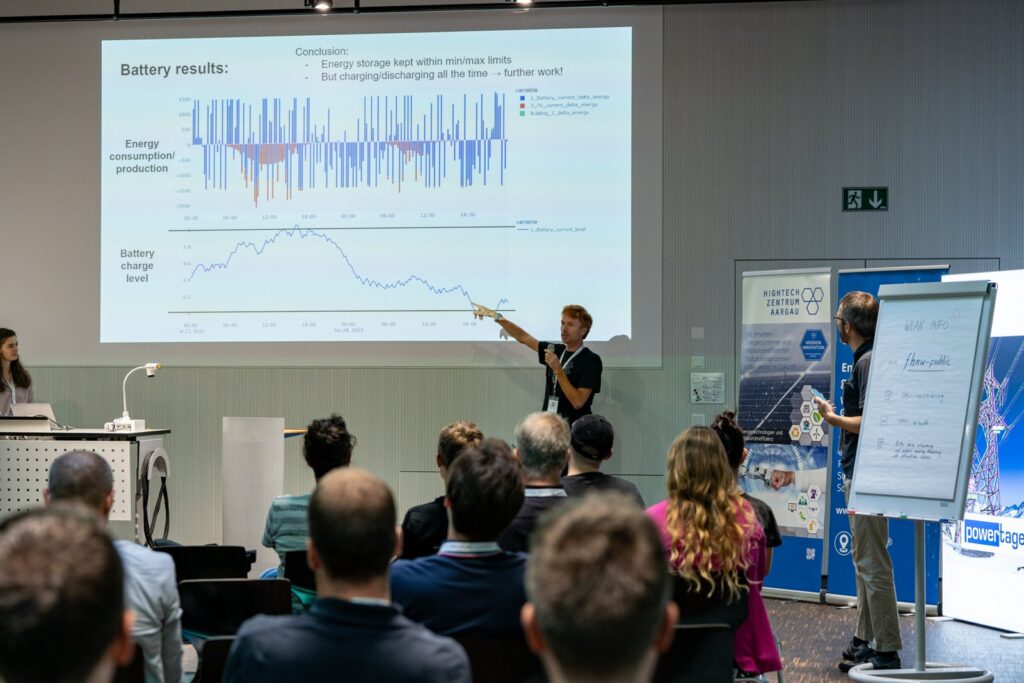
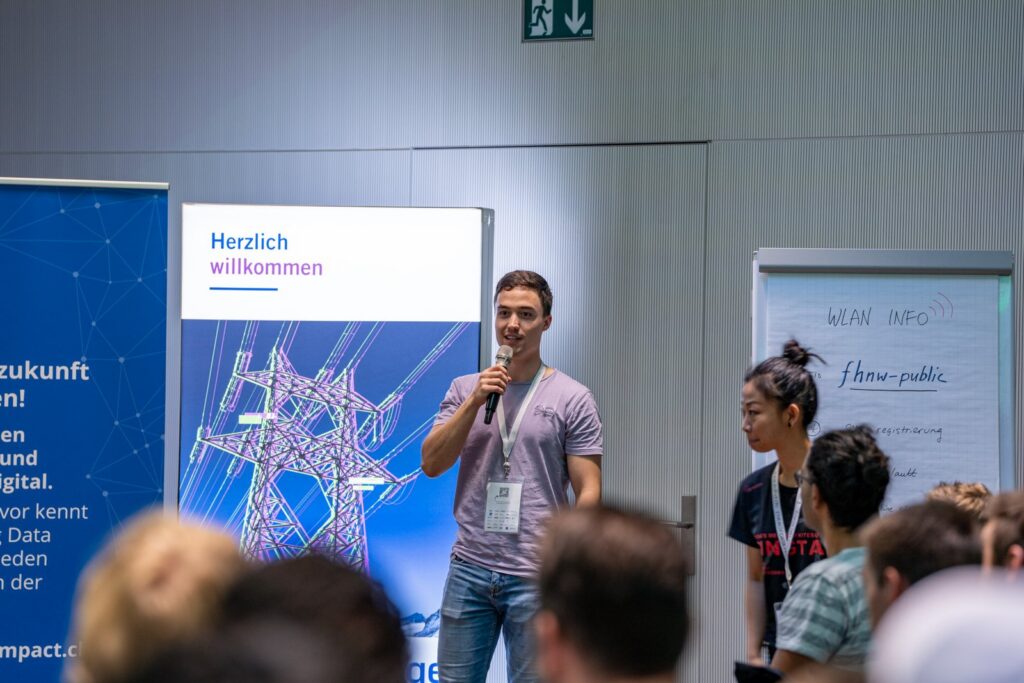
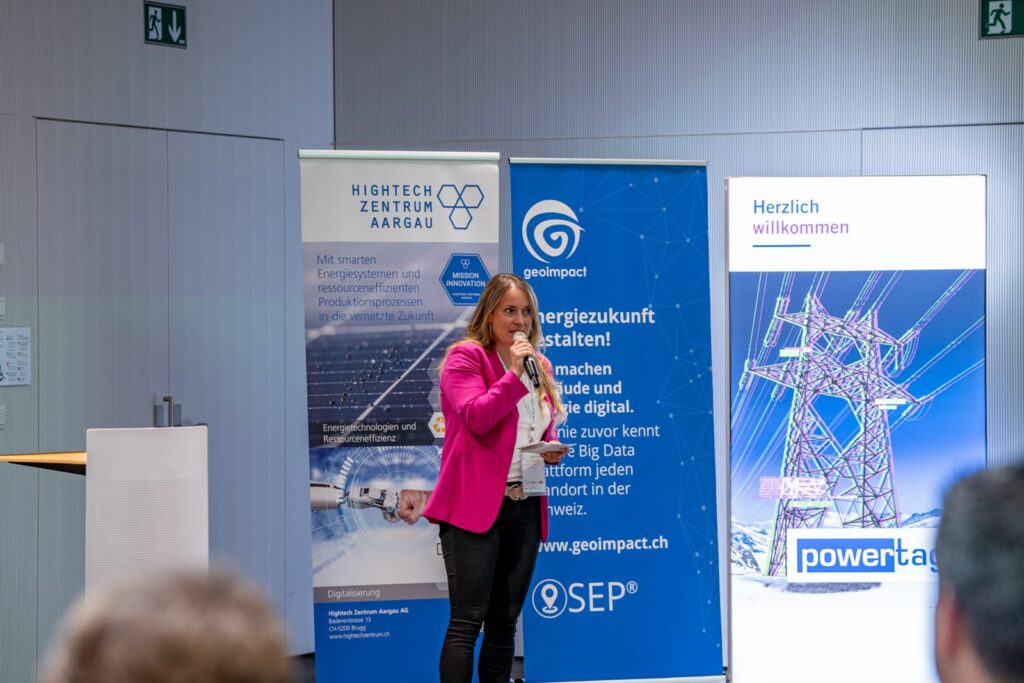
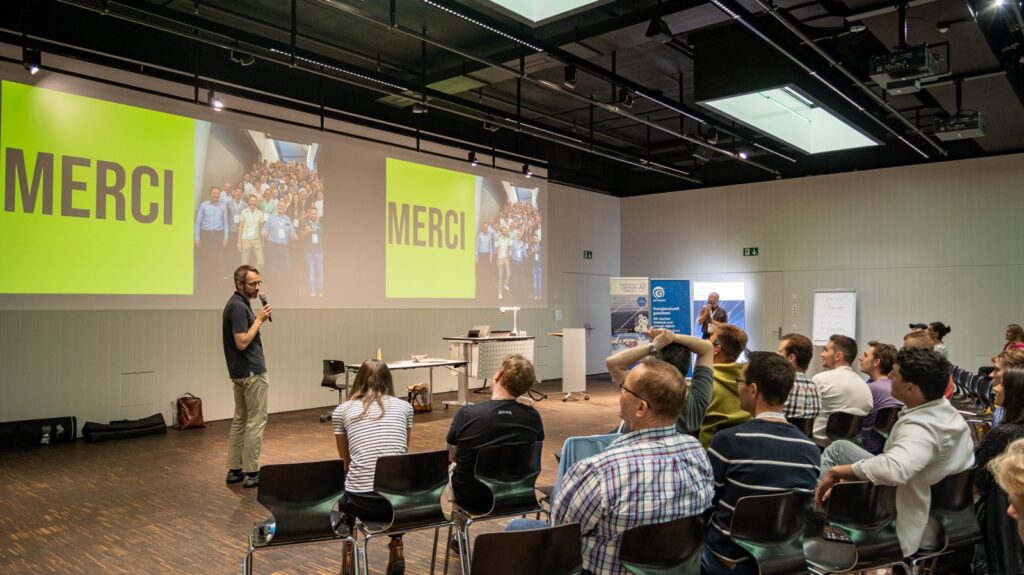
Foto: Nadine Zielinski (Hightech Zentrum Aargau)
Dokumentation und Aufzeichnungen
Challenges
- Assessing flexibility potential based on real-world e-mobility data
Discovering the flexibility / peak shaving potential in residential EV charging.
 Michele BollaFabian LüthardJan SchlegelManuel MeyerGiacomo PareschiMathias SteilenWinnie Chan
 Wolfram Willuhn
 Bill Zollinger
Challenge-Beschrieb
Residential e-mobility charging is expected to support the energy transition for increasing the share of renewable energy. However, the potential is often estimated based only on simulations and without any real-world data. In this challenge, you can assess the flexibility potential with unidirectional and bidirectional charging of residential e-mobility charging based on real-world data. For this purpose, we bring lots of real-world load- and charging data from over 500 charging stations and cars. What is the flexibility potential of this fleet of chargers and cars? How could this flexibility be utilized and how big are potential monetary benefits? How can flexibility and monetary benefits be increased by bidirectional charging compared to only unidirectional charging?
EKZ: Ludger Leenders, Bendikt Hilpisch
- Self-consumption optimization with artificial intelligence
Challenge-Beschrieb
Based on the energy platform VGT, data & controllable devices for a (virtual) area/building are available (solar system, storage, charging station + e-car, heat pump).
By means of an artificial intelligence to be developed / implemented, the (virtual) building is to be modeled based on the existing data.
Based on the weather forecasts, the (virtual) building shall be optimized either against the highest possible self-sufficiency level or against the lowest possible energy costs.
Different AIs can be implemented, since the VGT platform can be operated manufacturer-dependent.
Challenge Owner: AEW Energie AG und VGT AG
Dominik Hanisch
Flavio Müller
- Beyond Labels
Uncovering Flexibility Potential in Energy Consumption Data
Challenge-Beschrieb
Energy suppliers will be faced with an increasingly complex production and consumption landscape. In order to anticipate these complex changes new methods for categorizing customers or novel services are needed. This challenge focuses on new methodologies to detect the flexibility potential of prosumers. As novel smart-home devices will allow automatic control of high-power consumption devices like EV-charging, electric heating (heat pumps), tumble dryers in private households or even complex machinery in industrial facilities – flexibility is driven by energy efficiency or financial incentives via dynamic tariffs. One key aspect will be the maximal load of a household or an industrial facility on the local grid. Flexible tariffs are designed to reduce peak loads and will be a financial incentive for scheduling consumption and production. This challenge aims to identify unknown devices as flexibility potential in unlabeled consumption data – paving the way for smart tariffs and novel services in the portfolio of a modern energy supplier.
Challenge Owner: Primeo Energie AG
- Catching up with photovoltaic expansion
Published pv installed capacity underestimates pv production. We want to estimate pv installed capacity considering pv growth patterns
Challenge-Beschrieb
Pronovo is the entity that provides a very good overview of installed pv systems in Switzerland and many market players use the Pronovo database to estimate PV production .
Unfortunately, there are major delays between the installation of the pv systems and the recording in the Pronovo database.
This wasn't a bigger issue so far, but the swiss pv market is growing rapidly and so the lag is causing a general underestimation of pv power production.With additional information on the pv systems such as installation date, audit date, date of entry into the database, we would like to identify patterns, trends and seasonalities in order to be able to better and continuously estimate the current status of the pv expansion .
Pitch:
📎 BFE_challenge.pdf - Building Energy Insights - Empowering Building Owners
Create a user-friendly tool to offer building owners personalised insights for early and informed energy planning decisions
 Clara EsteveAline FreitasNoel OliveiraAlex WirzPatrice BlechschmidtChristoph ZempLukas GysinRamona MTobias Sigel
 Harald UllmannMatthias Sarbach
 André EggliSean GoffFelix MeierMarco InnigerFabian Eichenberger
Challenge-Beschrieb
Create a user-friendly tool to offer building owners personalised insights for early and informed energy planning decisions.
Open Data sources with APIs have been identified, as well as possible User Outputs and Web Design (Prototypes).
Define the Information that should be displayed to the users according to the available raw data
Define the logic necessary to go from the raw Open Data to the result information that will be displayed to the users
Prepare the data according to the defined logic to be used as a source table for the tool landing page
Web Design: analyse the already available prototypes and define how the user interface should look like for a user-friendly use of the platform
Customer Journey Design: this landing page provides information to the users about their building. It is the first step of the process. Define the Customer Journey the users should be guided through in order to go from the first expression of interest to making them actual clients
Web Development: Develop the Webapp. Available Tool: ArcGIS Enterprise Experience Builder (no-Code Tool). Available start code in Python, HTML, CSS. Any other Tool or Language however also possible.
Context
The city of St.Gallen and the OST Fachhochschule have been working together in an Innosuisse project, that found out that a lot of building owners are overwhelmed with energy issues. There are usually not well informed and only act when they have to, for example when the heating system is breaking down. Without planning ahead, the replacing technology will often be a fossil heating system (unless a local legal prohibition has already come into force). To avoid this, we want to provide building owners with personalized information about their building.Challenge Miro Board with Data, APIs and Design Prototypes: miro.com
Repo: https://gitlab.com/ssgw/
Live Plattform: https://energyhackday.mobiparking.ch/
Challenge Owner: SGSW
Clara Esteve, Ramon Schmid, Eren Baglar - Spatial Clustering for district energy
Ari JordanSimon ReichardMatteo ZoliJon Chambers
Challenge-Beschrieb
A big problem especially for local governments today is identifying regions of cities where district heating could be applied. In the past they used simple methods based on building densities and sizes. Machine learning can be used to improve on this.
Thanks to our models we know a lot about cities and districts. We are looking for novel ways to use machine learning clustering methods to generate clusters of buildings that are close together and share important characteristics for connecting to district heating.
Challenge Owner: Planeto Energy/University Geneva
Jonathan Chambers, Stefano Cozza - Spacial visualization of future energy scenarios
Challenge-Beschrieb
Energy system scenarios are often visualized in Bar charts. For switzerland, a lot of distributed energy investments are necessary in the future. To get a deeper understanding where and under which circumstances these investments are optimal, the spacial component should be added to the visualization. The degrees of freedom increases a lot and therefore a lot of creativity is required.
Develop a Map of switzerland to show the energy transition of the electricity system on a spacial level.
Data will be provided from the Nexus-e model.
Python/Matlab ArcGisPro
Challenge Owner: ESC/ ETH
Samuel Renggli - Identifying static yaw misalignment of wind turbines
Challenge-Beschrieb
When a wind turbine and the incoming wind are not perfectly aligned one speaks of yaw misalignment.
This causes a reduction in power production and unwanted mechanical stresses on various turbine components.In this case the turbine controller kicks in, checks the yaw misalignment, also called yaw error, and aligns the turbine with the wind in order to bring the yaw error back to zero.
However, a turbine might still be misalignment with the wind, even though the monitored yaw error is zero.
Potential reasons for this include malfunctioning sensors, issues with software, improper installation and others.
Having such a constant misalignment is called static yaw misalignment.The goal of this challenge is to identify static yaw misalignment and mitigate its effects on the turbine.
For the challenge two open source datasets of two wind farms will be availableChallenge Owner: OST
Florian Hammer - Day-ahead active losses forecasting
 Xiying Liu
 Tom Felder
 Adrian Rupp
 Patrick SchürmannPhilipp HillenJasper Meinert
 Tobias JuckerShajivan SatkurunathanJorge Goncalves
 Jeremy OlivierJérôme LevequeNoé Duruz
 Tim BreitenbachSandy DuruzMathias Steilen
 Florin Hasler
Challenge-Beschrieb
This challenge is about forecasting the transmission losses on the Swiss transmission grid. More specifically, you will be asked to forecast the losses for the next day in hourly resolution. As the transmission system operator in Switzerland, Swissgrid is responsible to procure energy to compensate losses on the transmission grid. Part of the procurement is done one day before the real present time. Based on the day-ahead forecast, we can know how much to procure. More accurate forecasting will help improve the procurement performance and therefore lower transmission system costs.
In this challenge, you’ll practice your machine learning skills in a well-prepared VM data science environment with cleaned training datasets from the energy industry.
You will have access to GPU for your machine learning models so you can focus on modelling!This is a great chance to explore different models and to improve your skills in forecasting.
Context:
The active losses on the transmission grid can be influenced by many factors, such as the historical active losses, renewable generation, cross border flows between Switzerland and the neighboring countries, weather, etc. The raw data will be provided as time series data between 2019 and 2021, in hourly resolution.The following datasets are provided for you to include in the model:
Historical active losses data
Solar generation data for Germany and Italy
Wind generation data for Germany and Italy
Temperature data for Switzerland, Germany, Italy, France
Net Transfer Capacity (NTC) between Swissgrid and the neighboring TSOs (NTC is the maximum exchange programme between two areas which is consistent with the security standards of both areas)Outcome:
The well-performed models will be introduced to our internal forecasting process and support us make better decisions in our market operational tasks, and will eventually help us improvement procurement performance and reduce procurement costs. This is your chance to make a real impact!We also have various experts from different parts of Swissgrid here so its also a chance to get to know us as an employeer.
Challenge Owner: Swissgrid
Liu Xiying, Tim Breitenbach, Giulio Ferraris - Predictive model for accurate production / consumption forecasts
Challenge-Beschrieb
In this challenge, we provide you with a dataset containing consumption/production profiles.
Your task is to develop a predictive model that can accurately forecast energy consumption/production patterns. The model needs to be deployed on a resource-constrained edge device, simulating real-world constraints. The targeted edge device is CLEMAP. For sake of simplicity, a virtual machine (VM) could be used to emulate the edge device with limited resources.To make the deployment process simple, we ask you to use NuvlaEdge technology. The main
goal is to deploy the developed forecasting module using NuvlaEdge, a powerful edge
computing platform. The objective is to optimize and efficiently use resources while achieving
accurate predictions.The evaluation of your solution will be based on the following criteria:
Model Performance: The accuracy of your predictive model will be assessed using the Mean Squared Error (MSE) score. We are looking for models that can effectively capture the energy consumption/production patterns and generate accurate forecasts.
Overhead: Your solution must be deployed on a limited resources device. It must also “cohabit” with NuvlaEdge. Avoiding overload and efficiently using the available resources will be crucial. It is therefore paramount that the footprint (CPU and memory) of your solution is as low as possible.
Optimisation: We encourage you to take into account optimization concerns. This includes strategies to minimize resource contention, reduce computational complexity, and optimize memory usage, all while maintaining accurate predictions.
Summary steps for the challenge:
Develop the forecasting module as a Docker container: Create a predictive model for energy consumption/production based on the provided dataset, and encapsulate it along with its dependencies into a Docker container.
Deploy the forecasting container: Use the NuvlaEdge platform to deploy the developed forecasting module.
Monitor/Optimise resource usage
Evaluate model performance: Assess the performance of your deployed model using evaluation metrics such as the Mean Squared Error (MSE) score.
By participating in this challenge, you will gain valuable experience in addressing the resource constraints and optimization challenges inherent in edge computing environments. Your contributions will drive advancements in energy forecasting and pave the way for efficient deployment of predictive models on edge devices.
Challenge Owner: HES-SO
Mohamad Moussa
Nabil Abdennadher
Philippe Glass
- Predicting Voltages in Substations
Prediction of Voltages in Substations for Grid Stabilisation
Adrian BuntschudavidLara BärtschiMarco SteinerAyam BabuAlison FerschFlorian BorterPascal CornuJeffrey HonoldNicolas DalloNicolas PelzmannChallenge-Beschrieb
For grid stabilization, operators of different voltage levels have target voltage schedules. These support grid stabilization. It is possible to influence the voltage in a substation with shunt reactors via reactive power compensation. Turning these shunt reactors on or off causes transients, which in turn cause wear and tear on the components of the substation and the shunt reactor. This means a grid operator wants to minimize the number of on/off switches of the shunt reactor while still using it to keep the voltage in the substation as close as possible to the target voltage published by the higher voltage level grid operator. We have time series measurements and target voltages for several of our substations with shunt reactors and aim to train a model that can tell us when to turn the shunt reactors on or off.
Challenge Owner: Axpo Grid AG
Nicolas Pelzmann
Tobias Schmocker
Sandro Renggli
- Disaggregation of electric charging from household consumption
Challenge-Beschrieb
Today’s energy supply is not up to the challenges of renewable, decentralized electricity production and the electrification of mobility and heat.
In a renewable energy supply, there is too much electricity when the sun is shining and too little when it is not. In addition, more and more electric cars and heat pumps will increase the demand for electricity and lead to more extreme load peaks. The electricity grid must become more flexible to react quickly to these fluctuations.
Electric cars are an essential flexibility to achieve this goal. Today, many utilities have limited knowledge about the amount and timing of charging in their grid. Within this challenge, we would like to address this issue using data analytics.
We will develop an algorithm to determine whether an e-car is present at this measuring point. The charging power should be disaggregated from the household consumption. Within the framework of a project, we have made initial evaluations and found that massively more e-cars were detected than were known to the distribution network operator.Future questions are:
Is it possible to detect charging using the load curves measured at transformation stations?
How much better is the disaggregation if we use high-resolution data instead of 15-minute values?Challenge Owner: aliunid AG und EKZ



Programm
Dienstag, 27. Juni
- 08:30
Pre-Workshop, Technopark Aargau, BruggPre-Workshop: Coffee & Gipfeli
- 09:00
Pre-Workshop, Technopark Aargau, BruggBreak Out & Brainstorm
- 10:30
Pre-Workshop, Technopark Aargau, BruggKaffeepause
- 11:00
Pre-Workshop, Technopark Aargau, BruggPresent & Cluster
- 11:30
Pre-Workshop, Technopark Aargau, BruggAdjust after Impact
- 12:30
Pre-Workshop, Technopark Aargau, BruggStehlunch
Freitag, 15. September
- 09:00
Start der Energy Data Hackdays: Begrüssung und Präsentation der Challenges
-
Teambildung und Hacking
Samstag, 16. September
-
Hacking
- –16:00
Schlusspräsentationen der Teams
Ursprüngliche Ankündigung lesen
Interessierst du dich für die Zukunft der Energiebranche? Begeistern dich die Möglichkeiten erneuerbarer und dezentraler Energietechnologien wie Geothermie, Wind- und Solarenergie? Möchtest du Teil einer gemeinsamen Anstrengung sein, reale Herausforderungen im Energiebereich zu lösen?
Dann laden wir dich ein, an den **Energy Data Hackdays 2023** dabei zu sein! Dieser Anlass bringt eine vielfältige Gruppe von Menschen zusammen, darunter Studierende, Hacker:innen und Fachleute aus dem Energiesektor. Gemeinsam erkunden wir innovative Wege, Energieerzeugung, -nutzung und -speicherung mithilfe modernster digitaler Werkzeuge zu optimieren.
An den Energy Data Hackdays 2023 vom 15. bis 16. September an der FHNW in Brugg-Windisch hast du die Gelegenheit, mit Fachleuten wie Energieanalyst:innen, Data Scientists und Programmierer:innen zusammenzuarbeiten. Du wirst herausgefordert, kreativ zu denken und Lösungen für reale Probleme der Energiebranche zu entwickeln.
Programm, Challenges, Beteiligte und Fotos stehen im Programm und im Rückblick.