Energy Data Hackdays 2024
- Energy
- Hackathon
12–13 septembre 2024, 08:00 @ FHNW Campus Brugg-Windisch, Gebäude 1, Bahnhofstrasse 6, 5210 Windisch, free
Organisé par Opendata.ch, Hightech Zentrum Aargau AG
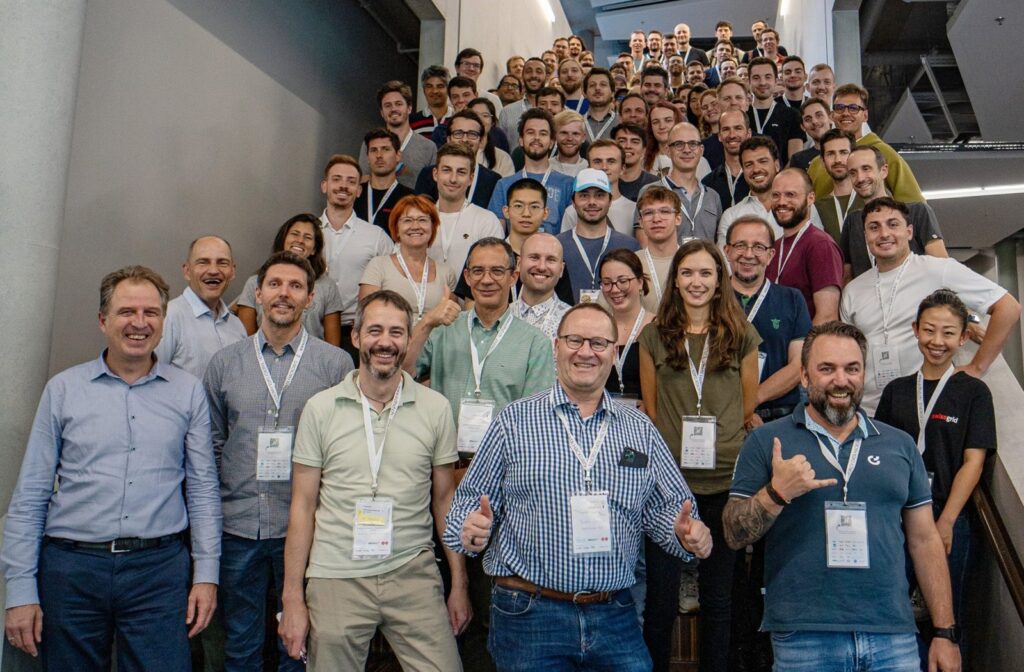
Photos
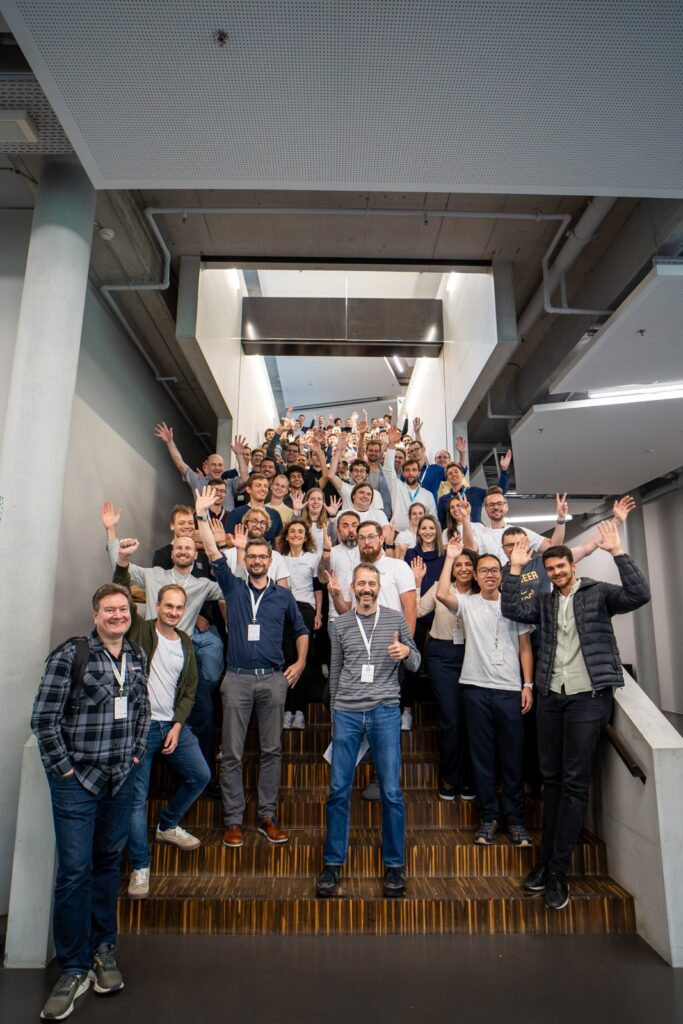
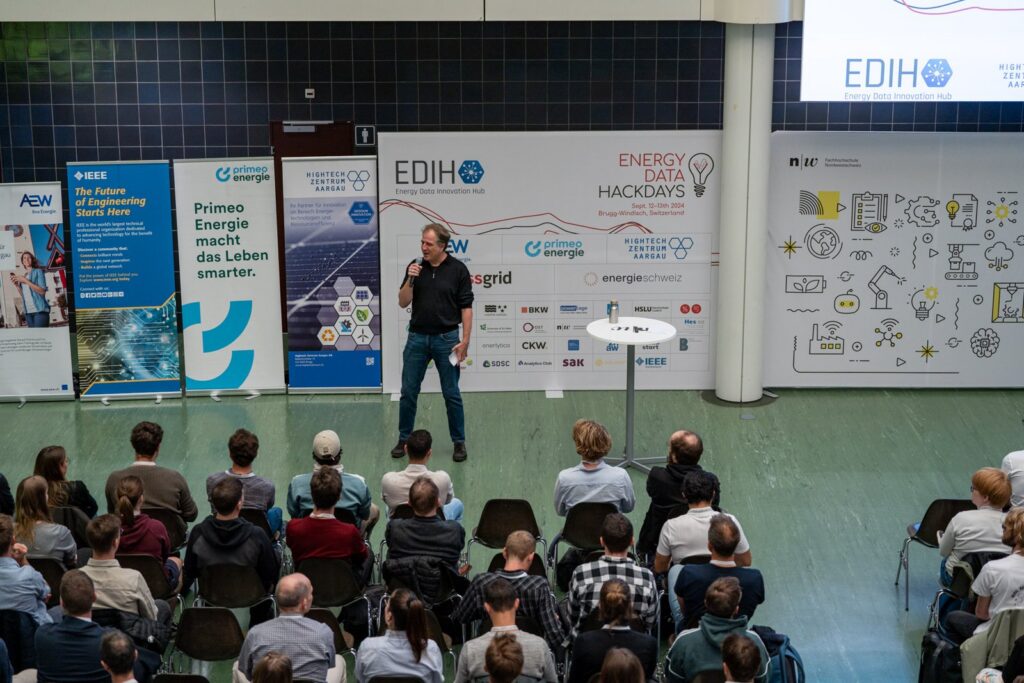
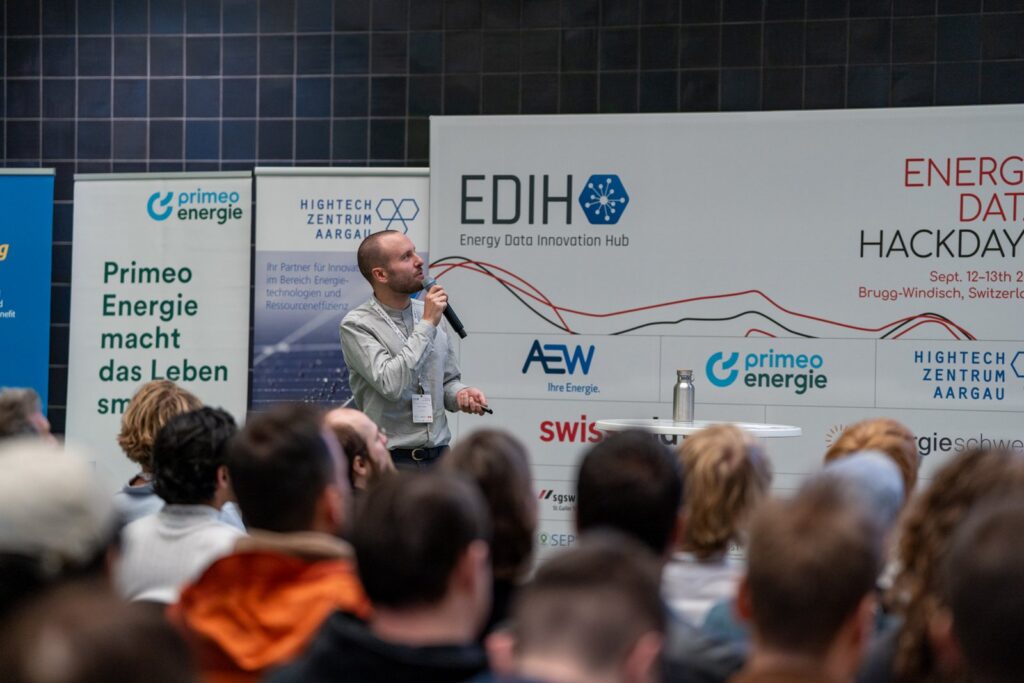
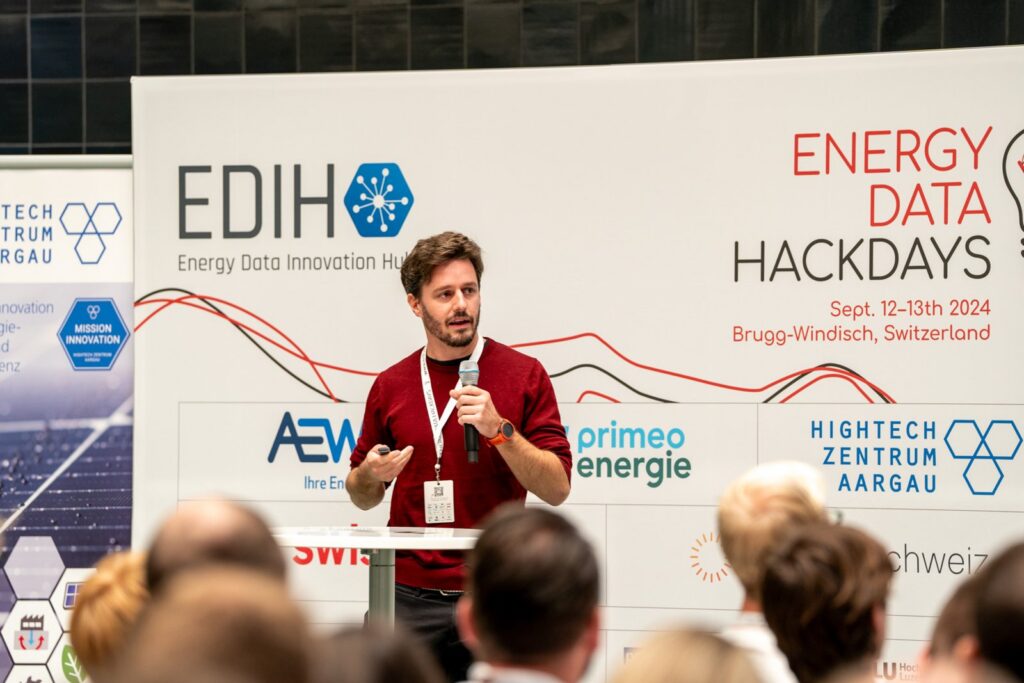
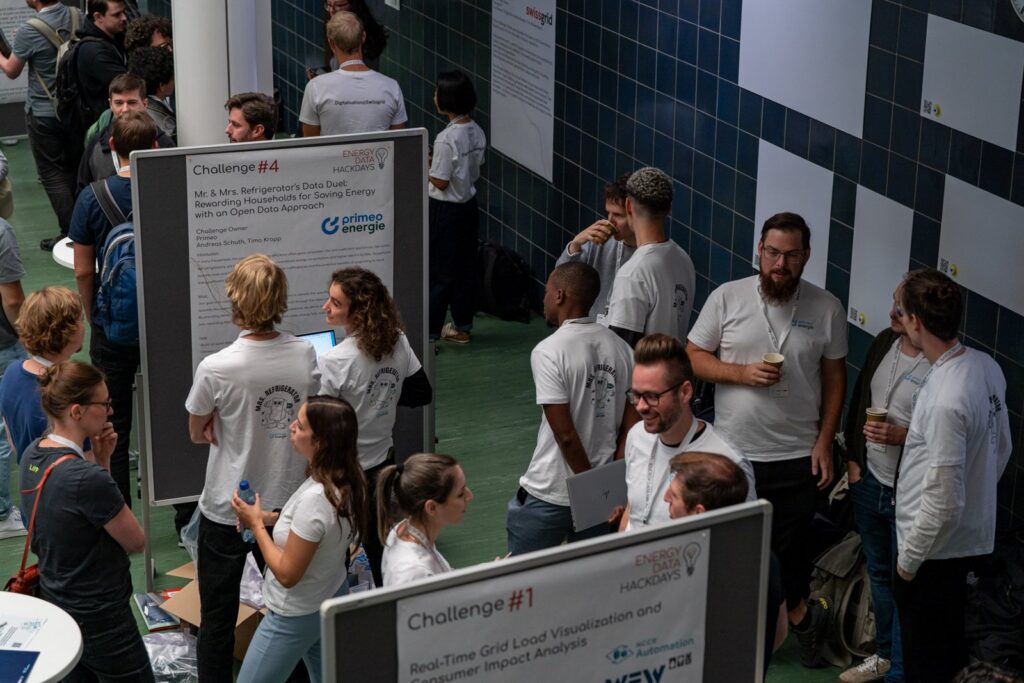
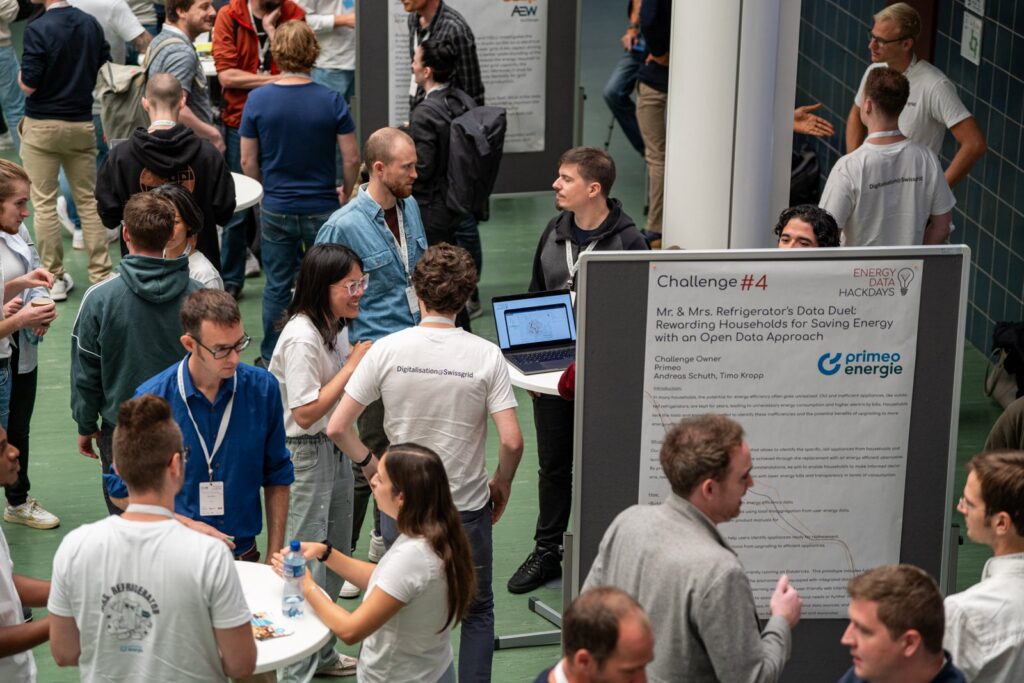
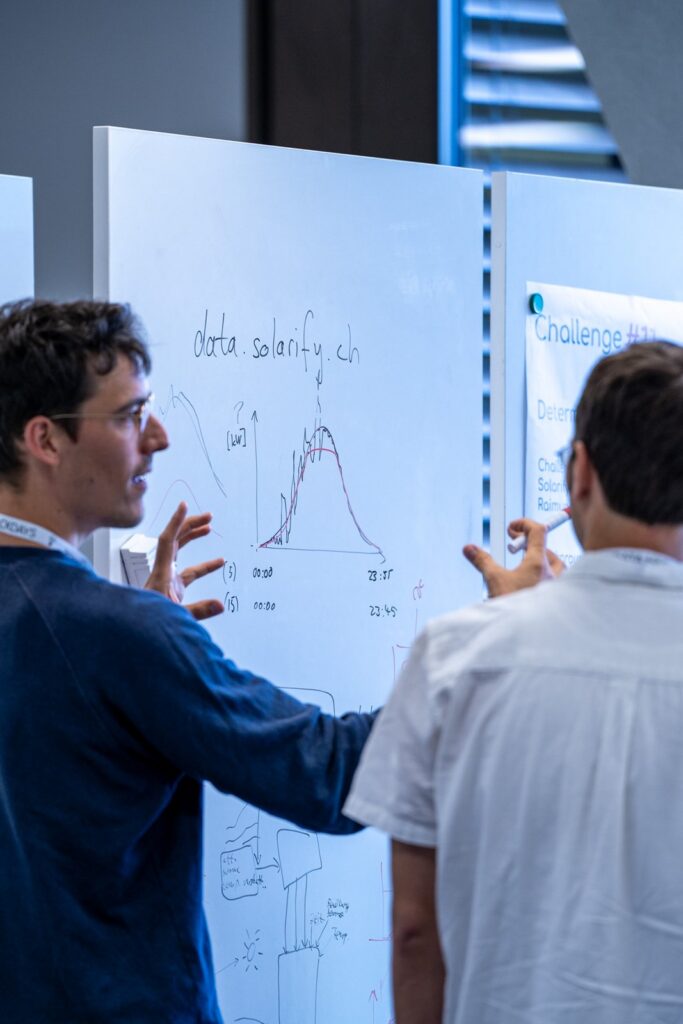
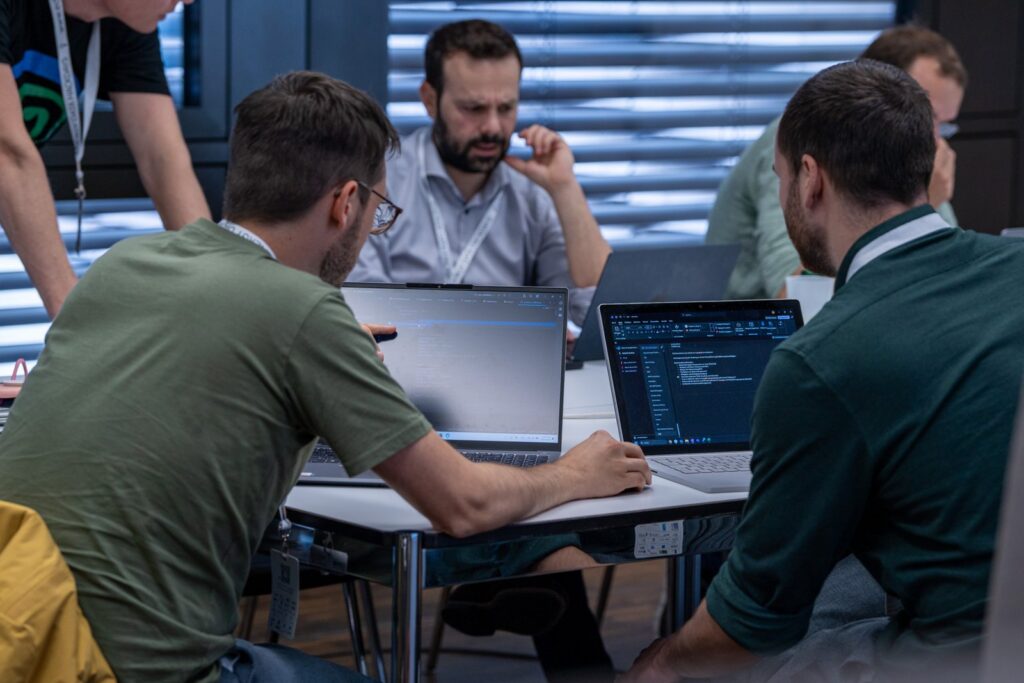
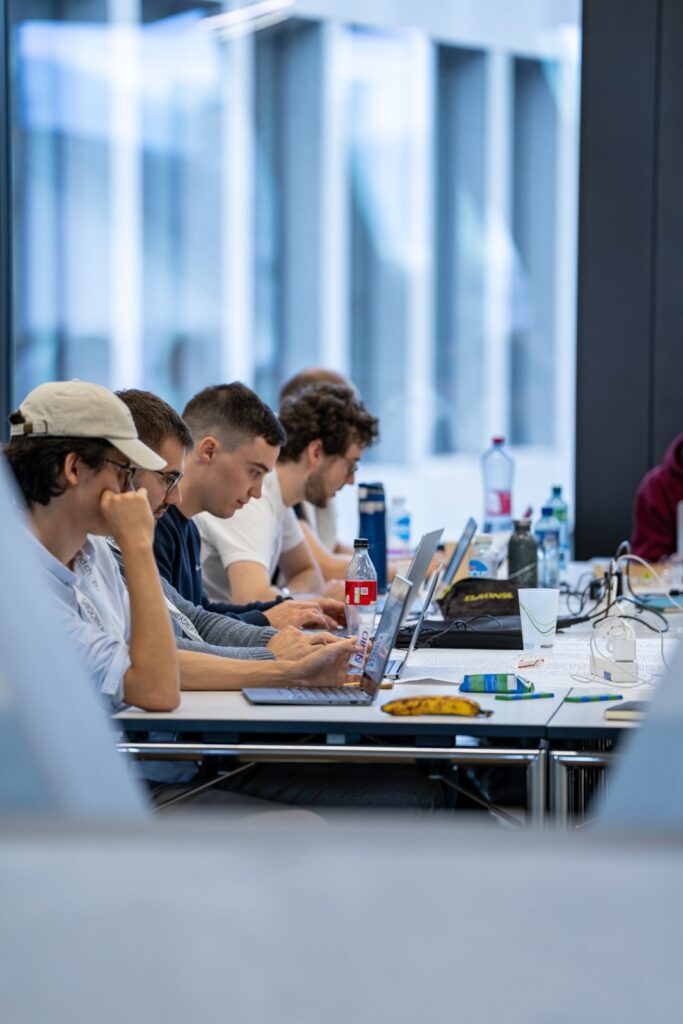
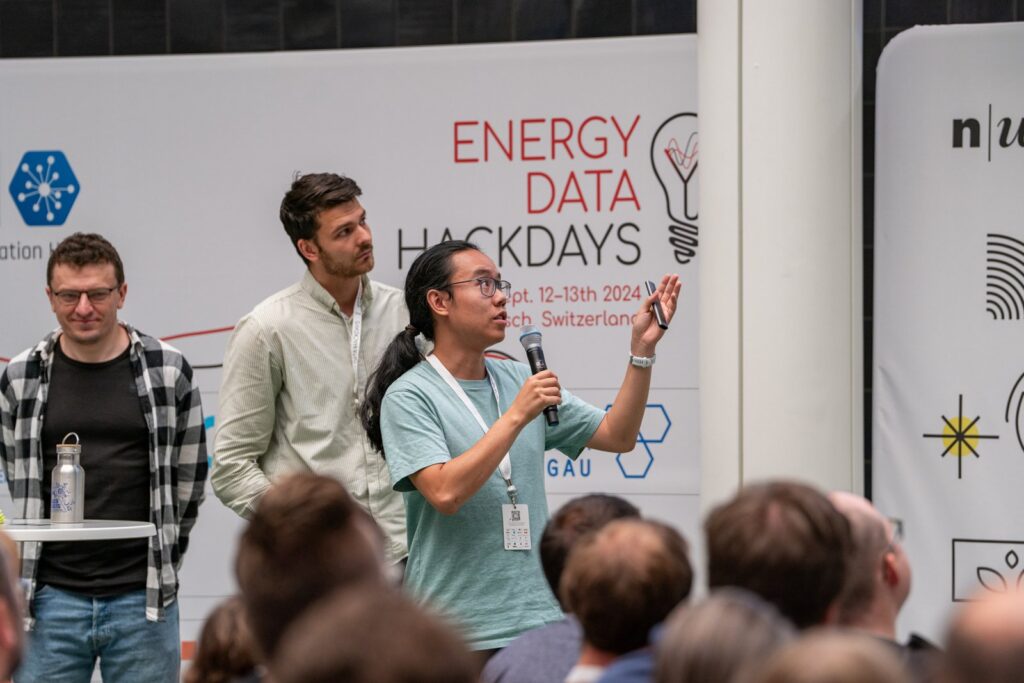
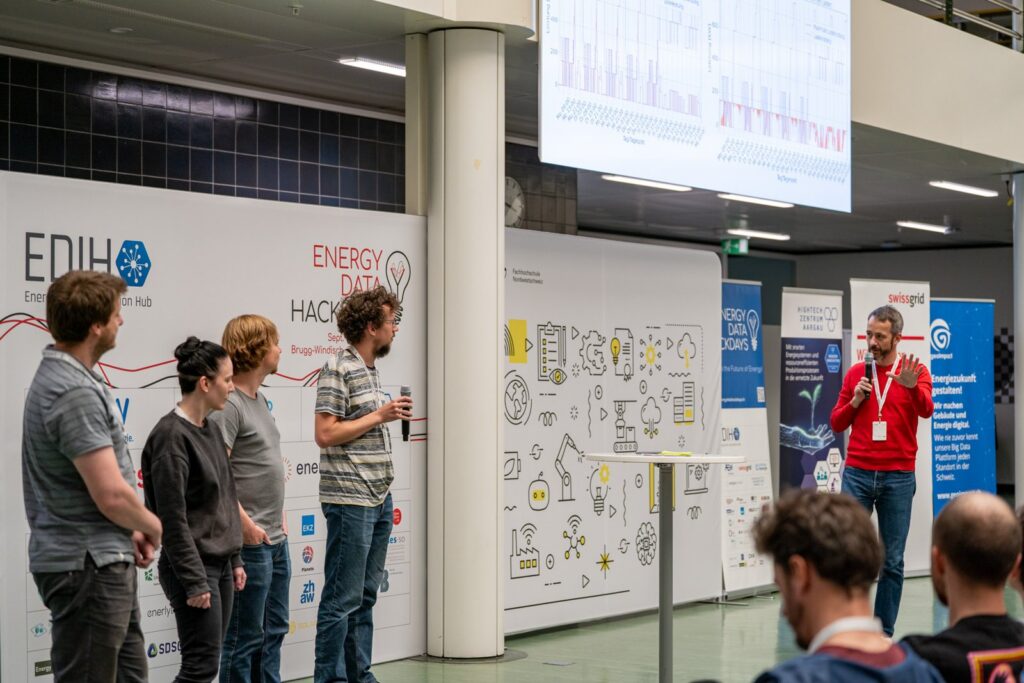
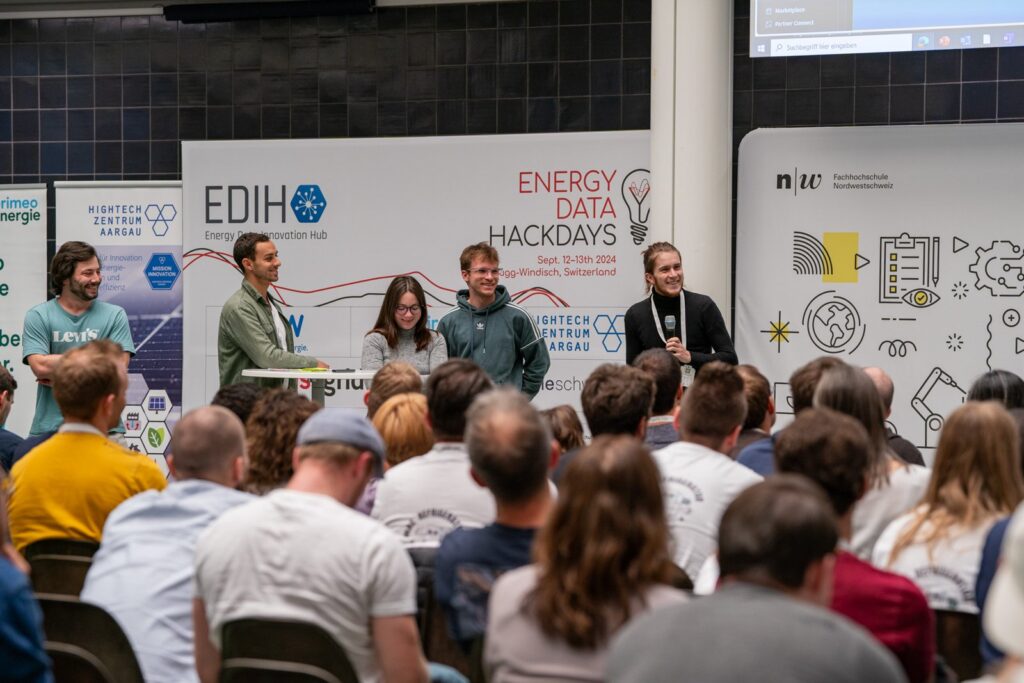
Photo: Hightech Zentrum Aargau
Défis
- Real-Time Grid Load Visualization and Consumer Impact Analysis
Description du défi
We aim to bridge the gap between end-users and the operational data of distribution grids by providing real-time, accessible visualizations of grid loads. We bring a hands-on challenge that leverages a hardware setup featuring a Janitza power meter, commonly used within distribution grids, alongside a local server infrastructure to read and store data in InfluxDB.
Challenge
Our challenge is to create a user-friendly web interface that visualizes the load measured by the Janitza power meter. This visualization could be represented in a form such as a traffic light system, signaling the maximum load levels. Additionally, we aim to incorporate sample household consumption data and explore how this individual data correlates with the overall grid pattern. The goal is to provide end-users with insights into their contribution to grid peaks (which can lead to higher costs) or their ability to consume anti-cyclically to help reduce peak costs.
Data
The hardware setup includes a Janitza power meter that will be connected to a local server, capturing data via Modbus and storing it in InfluxDB. We will also provide sample household consumption data for analysis and correlation with the grid load patterns.
Contact
NCCR und EW Walenstadt/ASGAL, Benjamin Sawicki & Thomas Gall
- Watts & Bots: Energizing Swiss Tariff Transparency with AI
Lukas Mona
 Angelos Selviaridis
 Giuseppe Giulio CaponettoShushi LuoMichael MazourikMaurice SifrigStefano SpadacciaThomas Strösslin
 Marina Gonzalez VayaMathias Niffeler
 David SuterPatrick Ploesser
Description du défi
Develop a GenAI solution using the OpenAI API, which can provide the end user with the correct detailed electricity tariffs of all individual products of each electricity provider (including the break-down of prices into the different components) for every municipality in Switzerland.
Challenge
There are more than 600 local electricity providers in Switzerland, each one of which has different electricity prices for different unique products, according to different customer types. As a result, at least a thousand of different electricity tariffs exist in Switzerland, a detailed overview of which does not exist. Elcom hosts a website, where the end customers can compare their tariffs to similar tariffs at other municipalities in Switzerland, however this comparison is a rather rough one, relying on average prices for high and low tariffs and on very specific (and rather unrealistic) assumptions about the electricity consumption of each customer type ( Strompreise Schweiz (admin.ch) ). Thus, the end customers cannot have an exact comparison of their electricity bill with other locations and energy companies do not have the exact data to test new products and services (electric mobility, battery storage etc.) and to perform the exact financial modelling needed for them to decide on where it is more profitable to operate and what to charge.
Here's a list of possible benefits of precise electricity tariffs per energy provider in Switzerland:
Electromobility:
Cost savings: Allows EV users to charge during cheaper periods.
Promotes EV adoption: Attractive tariffs for off-peak charging.
Energy Efficiency:
Optimized consumption: Encourages shifting energy use to lower-cost periods.
Supports efficient appliances: Incentivizes using energy-efficient devices.
Renewable Energy:
Boosts self-consumption: Favors users with solar panels to maximize self-produced energy.
Better integration: Optimizes use of solar/wind power.
Grid Stability:
Demand shifting: Reduces peak demand, enhancing grid stability.
Demand response: Enables participation in grid relief programs.
Customer Satisfaction:
Personalized tariffs: Tailored to individual consumption, increasing satisfaction.
Transparency: Offers better control over energy costs.
Competitive Advantage:
Market differentiation: Innovative tariffs set providers apart.
Customer acquisition: Attracts new customers with clear, attractive tariffs.
Environmental Impact:
CO2 reduction: Encourages renewable energy use and reduces peak consumption.
Sustainable practices: Incentivizes eco-friendly behavior.
Flexible Pricing:
Time-based tariffs: Aligns consumption with lower-cost periods.
Dynamic pricing:
Reflects real-time market conditions.
How
Data: The different tariffs can be found in PDF format on the Elcom website and are openly available on the Elcom website. Feel free to use your imagination to access further potentially valuable information online via web-scrapping
Solution: Use openAI models (or do you have a better idea?) to get the correct information (we can start with the x biggest utilitites in Switzerland and build it up from there).
Frontend (optionally): Provide a frontend for easy comparison of electricity prices in different regions and across different years in Switzerland
Benefits
Gain hands-on experience with the openAI API and test the LLM technology – worth it or hype debunked?
Learn about the different electricity tariffs and provide a fresh look into tariff differences across regions
Requirements
Coding skills (Python and/or Javascript preferred, others welcomed)
First experiences with GenAI and writing prompts
Creative thinking – let’s prototype
Links
Repository: https://github.com/geoimpact/electricity-tariffs
Key (encrypted): U2FsdGVkX1/e3dQHsSUfAtb1NqrtQfxriv5mT+UVXm808t4b3d2S/g+sMIYSj0hmRcv6byYw/N8tU938I12RYDWWxFuP/EIVuPxThADCw6X8IRaVce8EG4/N0dGPHtDhqNO/NIuQIeEfYzy3Z/GylhM2mgraoh5Ok77Dvro+od1RWe92mnD5sH9jbpcgGiLyjXQtMe1ifAEzqFA6BVGV03MCkOGfe1SRTYSygOUU20TkFxuyVK0TOhL4dyxH9sfB
Project Coordination: https://docs.google.com/document/d/1kzSg2NGnhJ7JnRw92oTBIT9yq9eGEWVUAH4OQuudQIs/edit
Contact
EKZ und GeoImpact, Angelos Selviaridis (EKZ) and David Suter (GeoImpact)
- Predicting Control Energy Volumes for Grid Stability
Description du défi
Develop a predictive model to forecast control energy activations for grid stability. Specifically, participants are tasked with estimating the daily activation volumes (in MWh) of automatic Frequency Restoration Reserve (aFRR) activations in Switzerland. This includes distinguishing between positive and negative activations. Additionally, participants should consider how future scenarios - such as the expansion of renewable energy, climate change, and the reduction of fossil fuels - might impact these activation volumes.
Challenge
Ensuring a stable electricity grid requires maintaining a perfect balance between electricity generation and consumption. As the energy landscape evolves rapidly with increasing renewable energy sources, predicting and ensuring grid stability becomes more challenging. Renewables like wind and solar power are variable and less predictable compared to traditional power plants, and the electrification of sectors like transport and heating further complicates power flow predictability. To manage grid stability, ancillary services such as aFRR are crucial, as they provide quick adjustments to electricity supply or demand. By predicting aFRR activations, we can better manage and schedule assets, identify potential market opportunities, and ensure grid reliability in the face of an evolving energy landscape. Predicting aFRR activation calls is particularly challenging, especially when simulating scenarios for the future up to 2050. This challenge aims to determine if the fundamental input and output data of a typical electricity price forecasting model can also be used to predict daily aFRR activation volumes.
How
Participants will
Data Access: Receive curated datasets containing historical records of aFRR activation calls (both positive and negative) in Switzerland for the years 2018 to 2023 and files containing potential input features. The datasets will be pre-processed and include key contextual factors relevant to the challenge.
Model Development: Develop predictive models using statistical and machine learning algorithms to predict daily aFRR activation volumes. Emphasize model simplicity and interpretability. Ideally, the model should provide not only a point estimate for daily aFRR call-off quantities but also a probability distribution for these quantities. Models will be evaluated on a test dataset from the year 2024.
Scenario Evaluation: Consider how future trends, such as increased renewable energy adoption, climate change, and reduced fossil fuel usage, might influence aFRR activation volumes. Visualize assumptions and findings.
Benefits
By participating in this challenge, you will gain hands-on experience in predictive modelling, data analysis, and the practical application of their work to real-world energy grid stability issues within a short timeframe.
You support grid operators and energy companies in forecasting future grid stability. In this way, you will help to better quantify the costs of expanding renewables and, at the same time, identify potential market opportunities for flexible power plants or storage systems (e.g. utility-scale batteries).
Establish contacts with BKW's flexibility and market analysis teams.
Contact
Jill Huber, Fabian Gottschlich, Tom Felder (BKW AG)
- Mr. & Mrs. Refrigerator's Data Duel
Rewarding Households for Saving Energy with an Open Data Approach
Diana PetrovicPetra SchärNicole KühniNair PujagicManuel ArteroFrederic NachbauerAndreas SchuthTimo KroppDescription du défi
In many households, the potential for energy efficiency often goes unrealized. Old and inefficient appliances, like outdated refrigerators, are kept for years, leading to unnecessary energy consumption and higher electricity bills. Households lack the tools and knowledge needed to identify these inefficiencies and the potential benefits of upgrading to more energy-efficient alternatives.
Presentation in PowerPoint öffnen
Challenge
What
Our goal is to create an open data foundation that allows to identify the specific, old appliances from households and quantify the potential energy savings that can be achieved through the replacement with an energy efficient alternative. By providing detailed insights and actionable recommendations, we aim to enable households to make informed decisions, rewarding their efforts in the energy transition with lower energy bills and transparency in terms of consumption.
How
Build an open data appliance catalogue with energy efficiency data
Develop a workflow to identify old appliances using load disaggregation from user energy data.
Implement image-to-text extraction from product manuals for appliance identification.
Create a questionnaire-based tool to help users identify appliances ready for replacement.
Visualize energy savings and cost reductions from upgrading to efficient appliances.
Where to start
We already have a prototype in place, which is currently running on Databricks.
This prototype includes fully set-up user accounts and a complete full-stack environment.
The environment is equipped with integrated data storage, connections to external data sources, pretrained machine learning models, and user-friendly web interfaces (using Gradio).
Additionally, Databricks personnel are available on-site to assist with any technical needs or further development.
This foundation allows you to immediately begin refining steps, integrating additional data sources, and enhancing the user experience, paving the way for a scalable solution that can be rapidly deployed and expanded.Contact
Primeo Energie , Andreas Schuth and Timo Kropp
- Impact of logistic truck electrification on electrical infrastructure
Description du défi
A research project between Coop, AEW and HSLU investigates the impacts of fleet electrification of logistic trucks on the local electrical infrastructure as well as the upstream power grid. A key aspect driving the needs for electrical infrastructure is a better understanding of the charging needs of a e-truck fleet, which reveals the energy required to maintain the operations of the fleet, required grid capacity, the battery sizes required for different routes etc. Moreover, it shall be analyzed if e-trucks can provide demand side flexibility for grid services and maximize use of local renewable production.
Challenge
Assess the operating schedule of a logistic truck fleet. What is the daily energy profile? What charging capacities are required to maintain the logistic operation. Can the charging processes be shifted or optimized? What is the potential flexibility that the e-truck fleet can provide?
Data
Weekly operating schedule of 160 vehicles serving north-eastern part of Coop super markets with exact departure and arrival times and locations, approximate vehicle load, etc.
Contact
Coop & HSLU, Severin Nowak (HSLU), Jamina Häseli (Coop)
- Applying graph theory to clean energy districts
Flow optimisation across heat networks
 Jonathan ChambersYuequn ZhangTristan MontalbettiKilian WerderTyler AndersonLeiv AndresenArmin BegicMathias SteilenLukas Ringlage
 Sari Issa
Description du défi
District heating networks provide heat to buildings through a network of underground pipes. Currently 80% of buildings in Switzerland still use oil and gas for heating, so we need new district networks to replace this with clean energy coming from renewable sources like heat pumps or waste heat from data centers.
Presentation in Google Drive öffnen
Challenge
Optimising the layout and routing through this network is an interesting graph theory challenge. While Minimum Spanning Tree algorithms allow us to get the overall shortest network, in reality district heat networks carry hot water flows and we want to minimse the overall flow to reduce energy loss, while also being able to add new network nodes.
In this challenge we will provide data for thermal networks represented as graphs, that participants can try different algorithms and solutions, and visualise the resulting heat flows.Contact
Planeto, Jonathan Chambers and Stefano Cozza
https://kdrive.infomaniak.com/app/share/745832/19ad001e-e849-4652-8132-f81f12ce5a3f
Data folder
https://kdrive.infomaniak.com/app/share/745832/90ca4574-d096-4672-bf44-db07a58fb955
Data and file drop box
https://kdrive.infomaniak.com/app/collaborate/745832/aa3f0bad-3645-485a-8c27-1a5376fc09c6Google Sheets slideshow to collect ideas and results
- Load Profile Clustering
Description du défi
The primary goal of this challenge is to develop an innovative solution that leverages public smart meter data to generate clusters of load profiles, highlighting patterns into energy consumption. Participants will be tasked with creating an innovative approach that not only identifies and categorizes these clusters but also provides actionable insights for optimizing energy use.
Challenge
Objectives
Main Objective: Develop a solution to generate load profile clusters based on public smart meter data.
Follow-up Objectives: Determine the sizes of clusters, visualize changes over time, identify key features of clusters, forecast cluster changes, and propose solutions to shift consumers between clusters.
Tasks
Cluster analysis: Determine the optimal sizes and boundaries of these clusters.
Temporal Visualization: Visualize how these clusters evolve over time to understand dynamic consumption patterns.
Feature Identification: Identify the key characteristics that define each cluster.
Forecasting: Predict future changes in cluster composition and behaviour.
Consumer Shift Strategy: Propose actionable strategies to help consumers transition between clusters, optimizing energy consumption and efficiency.
Contact
Axpo/CKW, Maksim Kapustsin, Ilaria Mastromarino and Roman Sonder (CKW)
- Prediction of PV installation angles
- Week-ahead Load Forecasting
 Jeremy OlivierValentin MorelSandy DuruzSamuel BarsGiancarlo MeccarielloYanis LupbergerNoé DuruzMathias MoserJan-Christian Vahldiek
 Guido Oswald
Description du défi
This challenge invites you to predict the load on the Swiss transmission grid, for the next week, in hourly resolution. The load forecast is used to support some of the core operational tasks in Swissgrid, for example, from weekly planning to near-real-time operation. Load can be influenced by many factors on the grid, including historical load, weather, generations, seasonality, etc. You will get hands on the actual historical load data and other important inputs data to generate week-ahead load forecast. The improvement introduced in this forecast will be examined and applied to our operations when the performance is confirmed to be better – so this is a great chance to make the real impact to the energy industry.
Contact
Swissgrid AG, Liu Xiying, Thiago Raiz, Malte Rohden and Tim Brietenbach
- Orchestrating energy system simulations from different models
Description du défi
What is the challenge?
This is a coding challenge. The goal is to design a library in Python to interact with energy system models data. It will involve identifying the needs from the modelers and the limitations a library like this will inevitably have. The idea is to provide the different models with a common interface that can read data from different sources and formats.
Why?
Our software, Nexus-e, currently orchestrates five different models to solve energy system optimizations problem. It does so by tightly coupling the different models together with very specific solutions to exchange data between the models. We want to develop this library in order to decouple our current models and to welcome new models in our ecosystem.
Background
Nexus-e enters a new development phase where we want to make it truly modular by implementing a plug-in architecture. By doing so we want to enable different energy system models to easily become a Nexus-e plugin. The library developed during this challenge will be the first step of this process.
Data
We will provide a scenario (set of input data) from a Nexus-e simulation and a scenario from another model along with these two models respective codebase.
Contact
ESC/ETH, Jonas Savelsberg and Matthieu Boubat
- Determining the signature of a solar system
Description du défi
The production of a solar system (photovoltaic system, PVA) depends on many factors. However, under ideal conditions, every solar system has a characteristic output curve that depends on the characteristics of the system, such as orientation and shading.
Challenge
Data
For this challenge, anonymised data from real PV systems is provided. This data can be crossed with weather data on solar radiation and cloud cover to analyse the production patterns of the systems.
Aim
The aim of this challenge is to develop an (AI-) supported model that determines the characteristic signature of a solar plant. This signature ‘S’ depends on factors such as orientation, shading and other characteristics of the system.
Applications
The developed model can then be used with the following applications: - Comparison of effective and expected production for performance review - Forecast of plant production for timetables in the control energy sector, portfolio optimisation, etc. - The model can be used in simulations of any kind at Solarify.
Contact
Solarify : Raimund Neubauer, Roger Langenegger
- Characterisation of demand side flexibility
Description du défi
In a collaboration between SAK and HSLU, heat pumps and electric boilers in a pilot area were retrofitted with sophisticated metering and control hardware. Aim of the project is to monetise demand side flexibility through a local flexibility market platform. Demand side flexibility shall be used in a coordinated way for DSO peak shaving, BRP portfolio optimization, as well as TSO balancing services.
Challenge
Assess the suitability of the various devices to provide flexibility. How well do they react to the external control signal? How accurately can the energy consumption be predicted and shaped in practice? How much could this flexibility be worth?
Data
Anonymized consumption data from heat pumps and boilers in 30 second resolution over multiple weeks, including historical activation signals.
Contact
SAK und HSLU, André Egli (HSLU) and Lukas Zigerlig (SAK)
- When do Balance Energy Prices Skyrocket?








Programme
Jeudi 12 septembre
- 08:00
Lichthof, bâtiment 1Accueil / inscription
- 08:30
Lichthof, bâtiment 1Café & croissant de bienvenue
- 09:00
- 09:30
Lichthof, bâtiment 1Pitchs des challenges
- 10:30
Lichthof, bâtiment 1Formation des groupes
- 11:00
3e étage, bâtiments 5 & 6Début du hacking
- 12:30
Cafétéria FHNW ; 3e étage, bâtiments 5 & 6Déjeuner & hacking
- 13:30
3e étage, bâtiments 5 & 6Suite du hacking
- 19:00
Bar du rez-de-chausséeDîner
- 20:00
3e étage, bâtiments 5 & 6Suite du hacking – sans heure de fin


Vendredi 13 septembre
- 08:00
3e étage, bâtiments 5 & 6Petit-déjeuner et reprise individuelle du hacking
- 12:00
3e étage, bâtiments 5 & 6Déjeuner
- 15:30
Lichthof, bâtiment 1Présentation des résultats
- 17:00
Lichthof, bâtiment 1Apéro et célébration
Lire l’annonce d’origine
Des changements fondamentaux se profilent dans le secteur de l’énergie. La fin de la durée de vie des centrales nucléaires exige le développement de technologies énergétiques diversifiées, renouvelables et décentralisées, comme la géothermie, l’éolien et le solaire. Des outils numériques sont utilisés dans de plus en plus de domaines afin d’optimiser et de stabiliser l’interaction entre l’offre, l’utilisation et le stockage de l’énergie.
Nous avons le plaisir d’annoncer qu’après les bonnes expériences et les bons résultats des Hackdays depuis 2019, la prochaine édition des Energy Data Hackdays aura lieu à Brugg-Windisch avec des partenaires existants et nouveaux. Fidèles à la tradition.
Les hackathons réunissent des expert·e·s de l’énergie, des analystes, des data scientists, des programmeuses et programmeurs, des étudiant·e·s et des personnes intéressées de toutes les disciplines pour travailler ensemble, avec esprit d’équipe et enthousiasme, à des solutions à des problèmes concrets. Participe !
Où et quand ?
Quand : jeudi 12 septembre et vendredi 13 septembre 2024.
Où : Fachhochschule Nordwestschweiz, Campus Brugg-Windisch
Programme 2024
- Jeudi 12.09.2024
- 8.00 · Accueil/inscription (Lichthof, bâtiment 1)
- 8.30 · Café & croissant de bienvenue (Lichthof, bâtiment 1)
- 09.00 · Ouverture, introduction + keynotes (Lichthof, bâtiment 1)
Bienvenue et brèves introductions
Florin Hasler (opendata.ch)
Matthias Eifert (Hochschule Luzern)
Keynote – Numérisation @Swissgrid
Tim Breitenbach, Head of Data & Governance, Swissgrid AG
- 09.30 · Pitchs des challenges (Lichthof, bâtiment 1)
- 10.30 · Formation des groupes (Lichthof, bâtiment 1)
- 11.00 · Début du hacking (3e étage, bâtiments 5&6)
- 12.30 · Déjeuner (@ cafétéria FHNW) & hacking (3e étage, bâtiments 5&6)
- 13.30 · Suite du hacking (3e étage, bâtiments 5&6)
- 19.00 · Délicieux dîner (bar du rez-de-chaussée)
- 20.00 · Suite du hacking – sans heure de fin (3e étage, bâtiments 5&6)
- Vendredi 13.09.2024
- 8.00 · Petit-déjeuner et reprise individuelle du hacking (3e étage, bâtiments 5&6)
- 12.00 · Déjeuner (3e étage, bâtiments 5&6)
- 15.30 · Présentation des résultats (Lichthof, bâtiment 1)
- 17.00 · Apéro et célébration (Lichthof, bâtiment 1)
Plus d’informations
La modération et les présentations se déroulent en anglais.