Energy Data Hackdays
- Hackathon
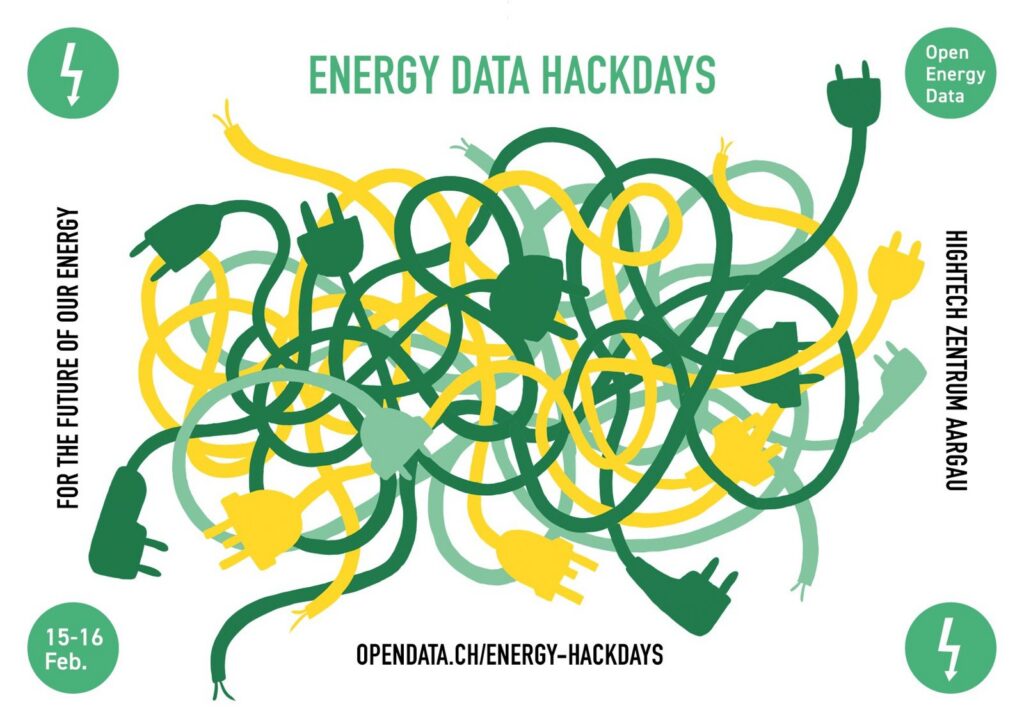
15–16 février 2019 @ Hightech Zentrum Aargau, Badenerstrasse 13, 5200 Brugg
Organisé par Opendata.ch, Zukunftsregion Argovia
On 15 and 16 February 2019 the Energy Data Hackdays took place in the Hightech Centre Aargau in Brugg. Thanks to open energy data, we improved our common understanding of energy, and worked on 13 potential solutions to increasing energy efficiency in Switzerland in the future.
Photos
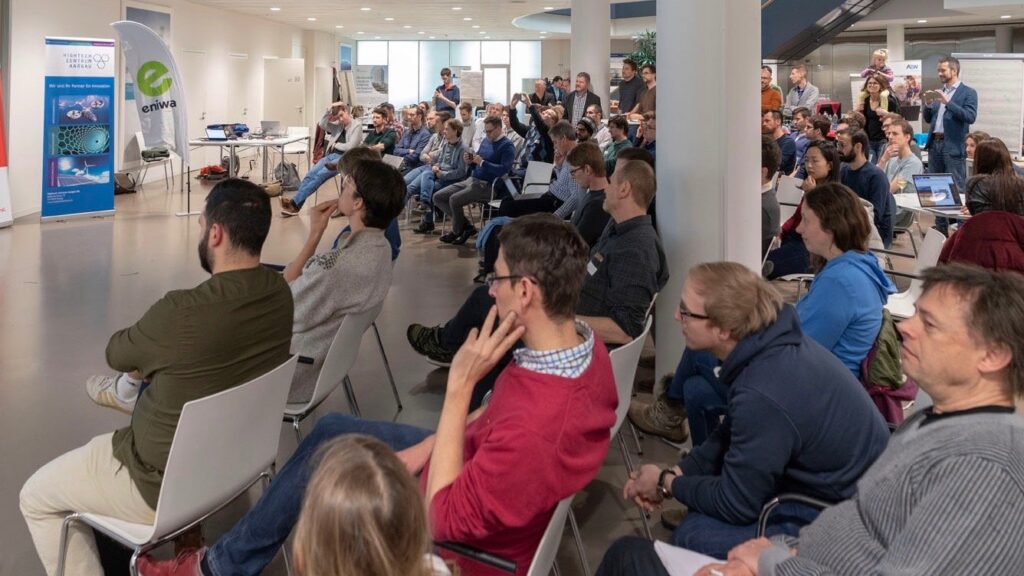
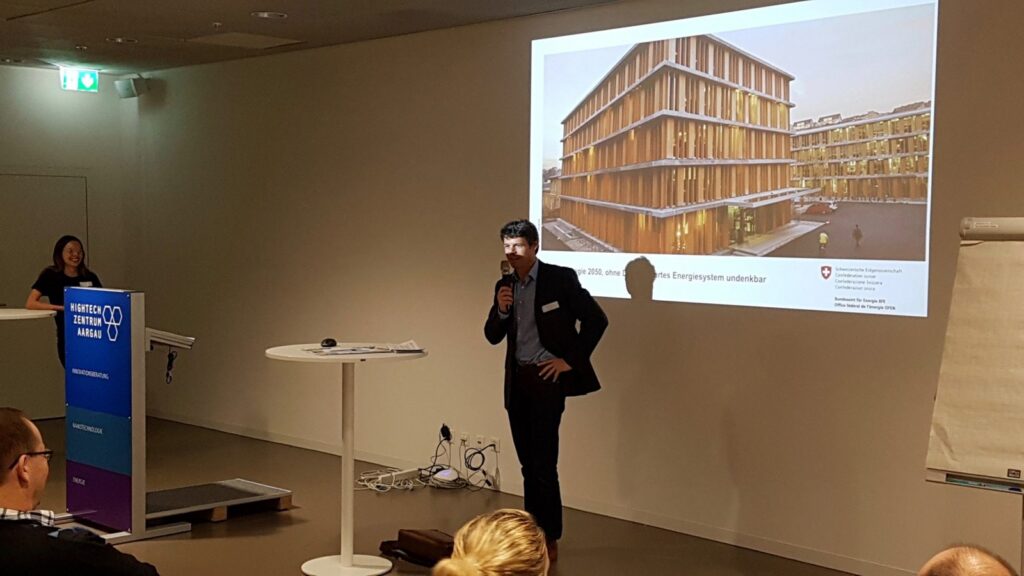
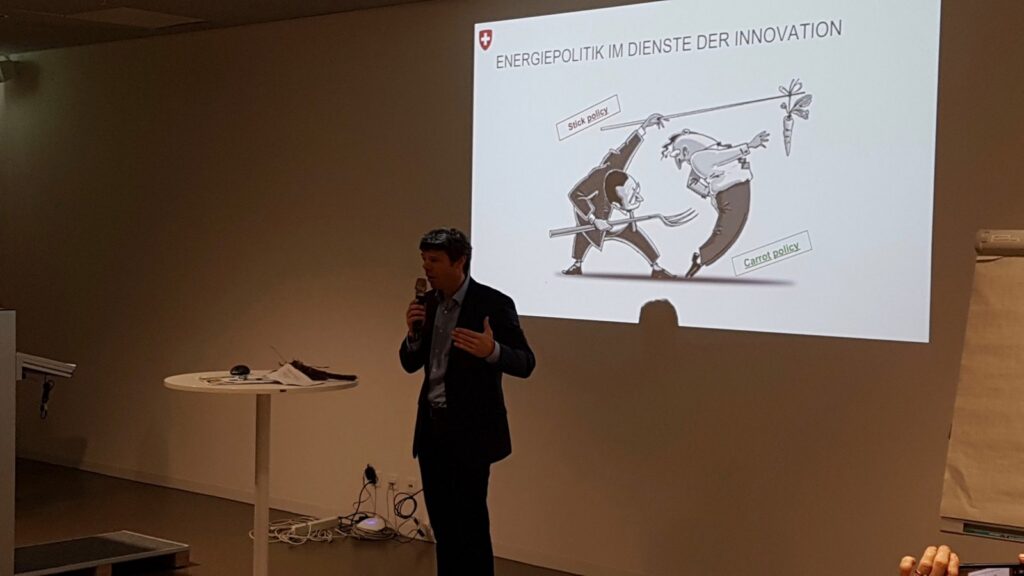
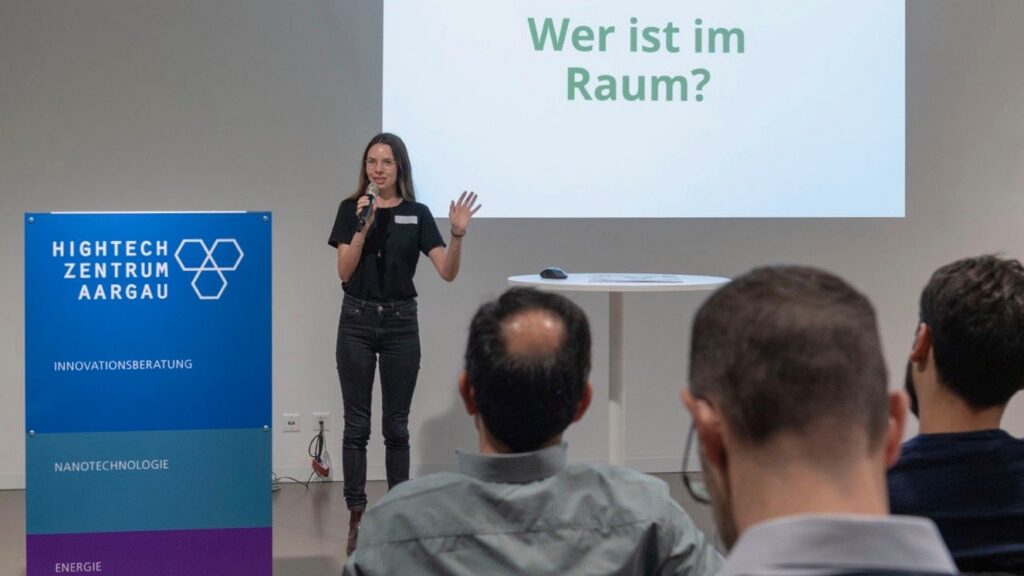
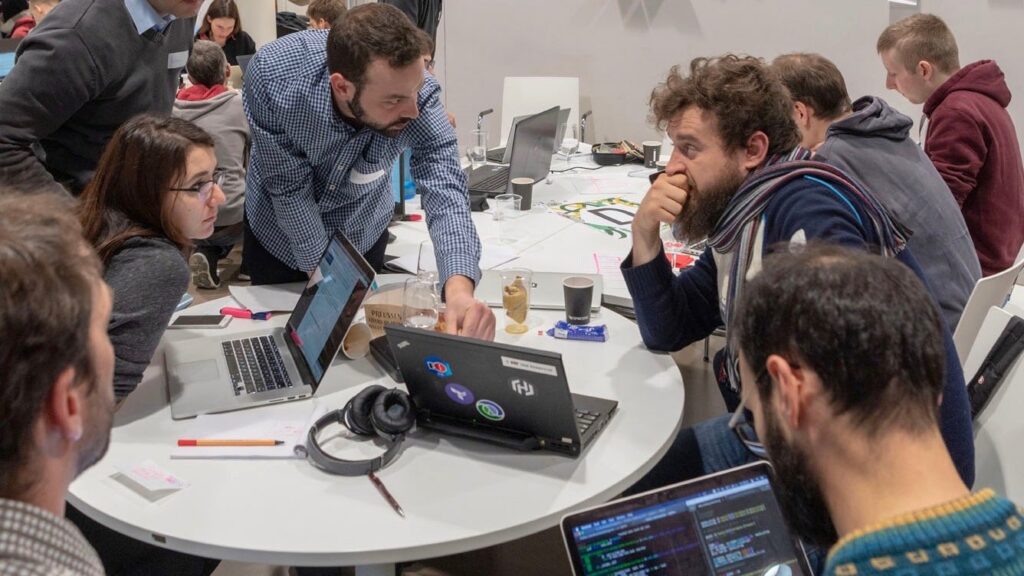
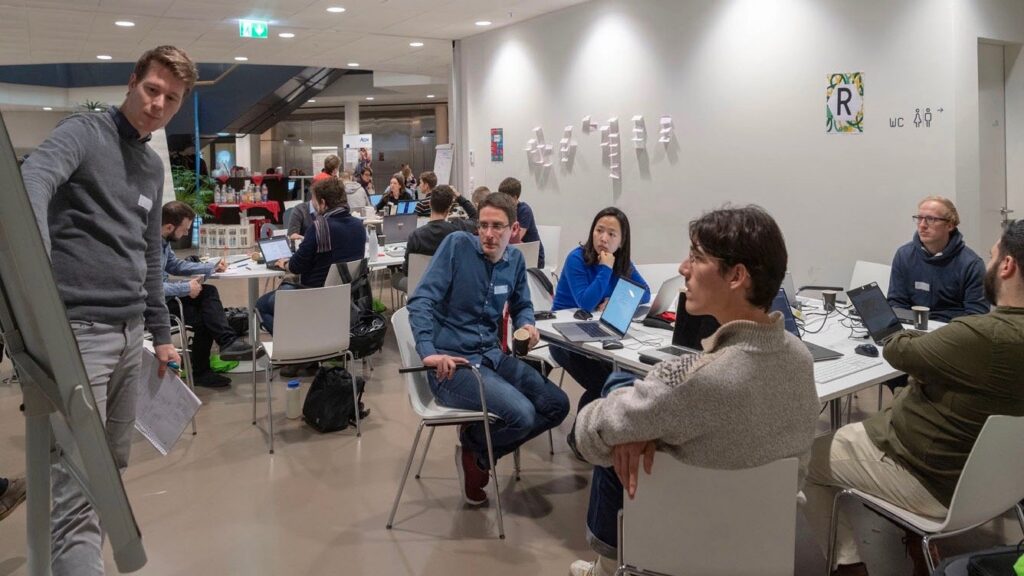
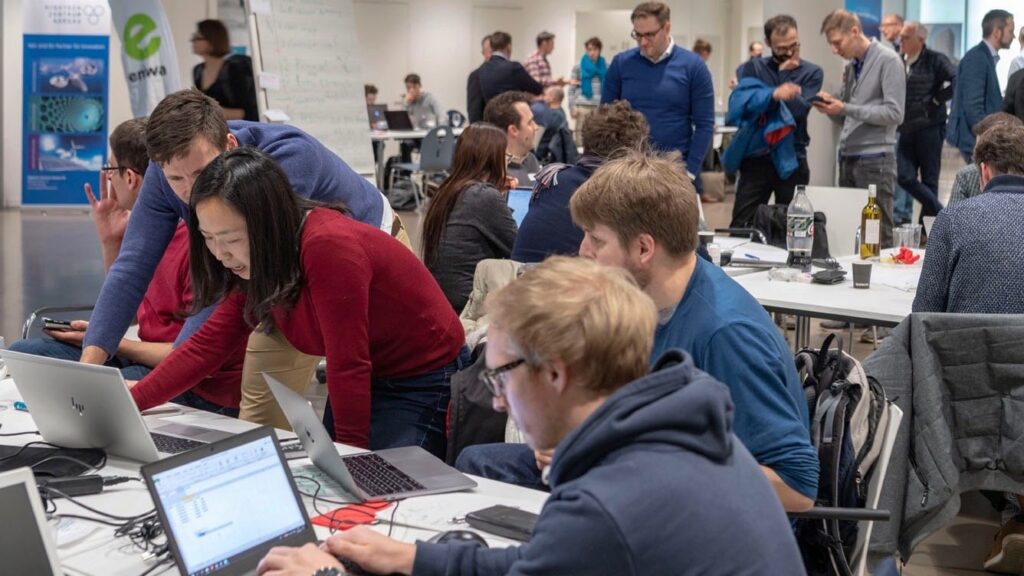
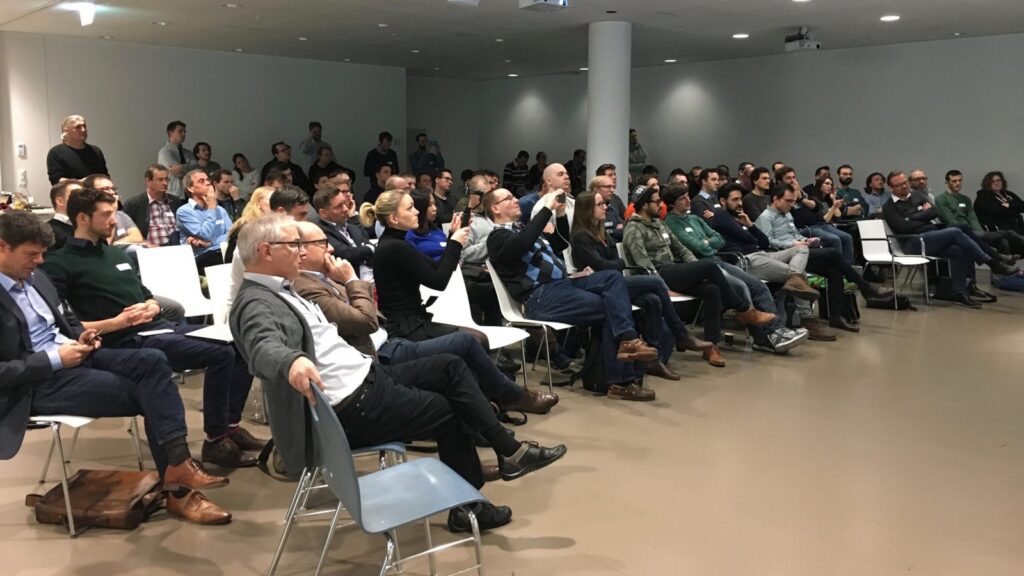
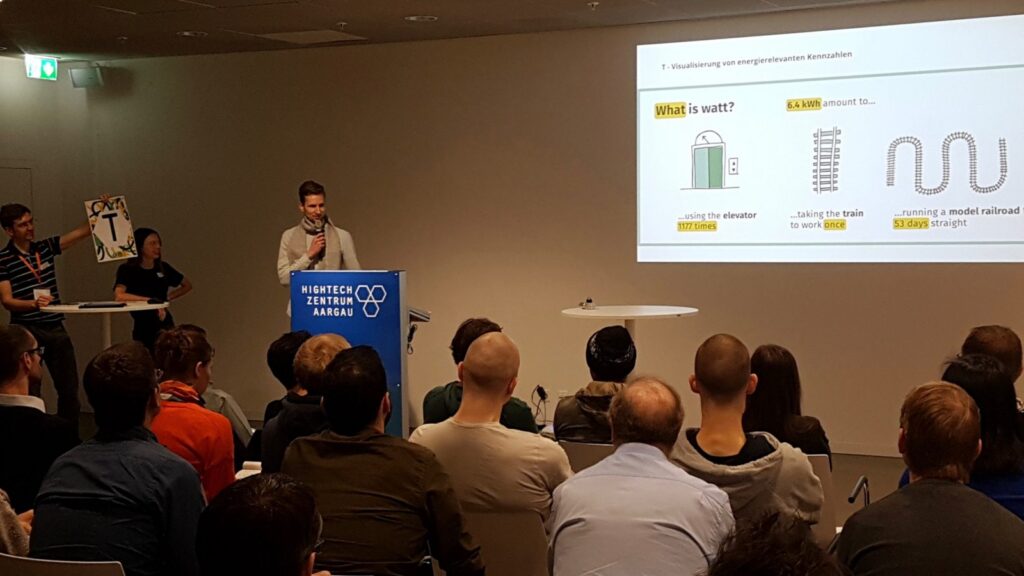
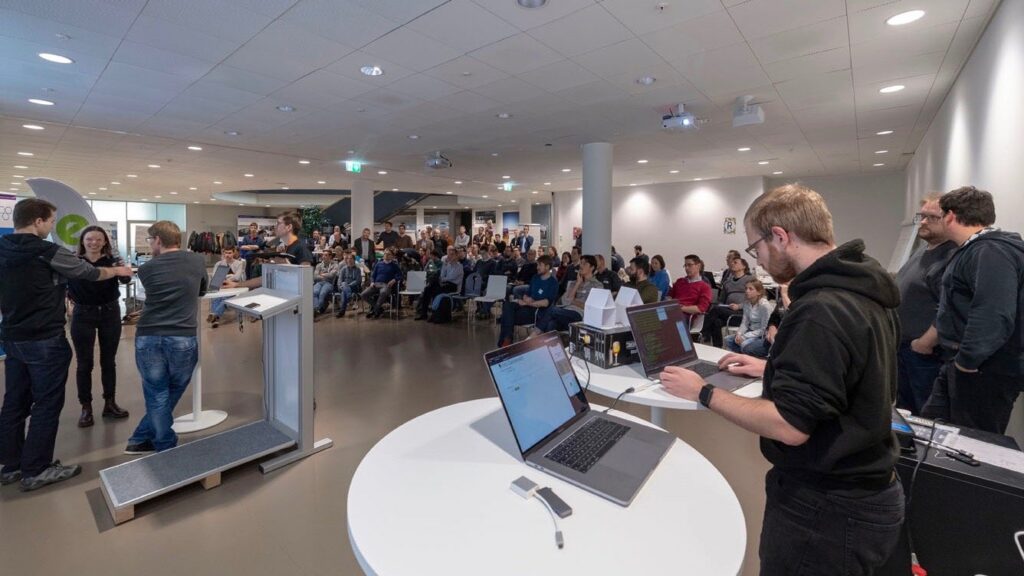
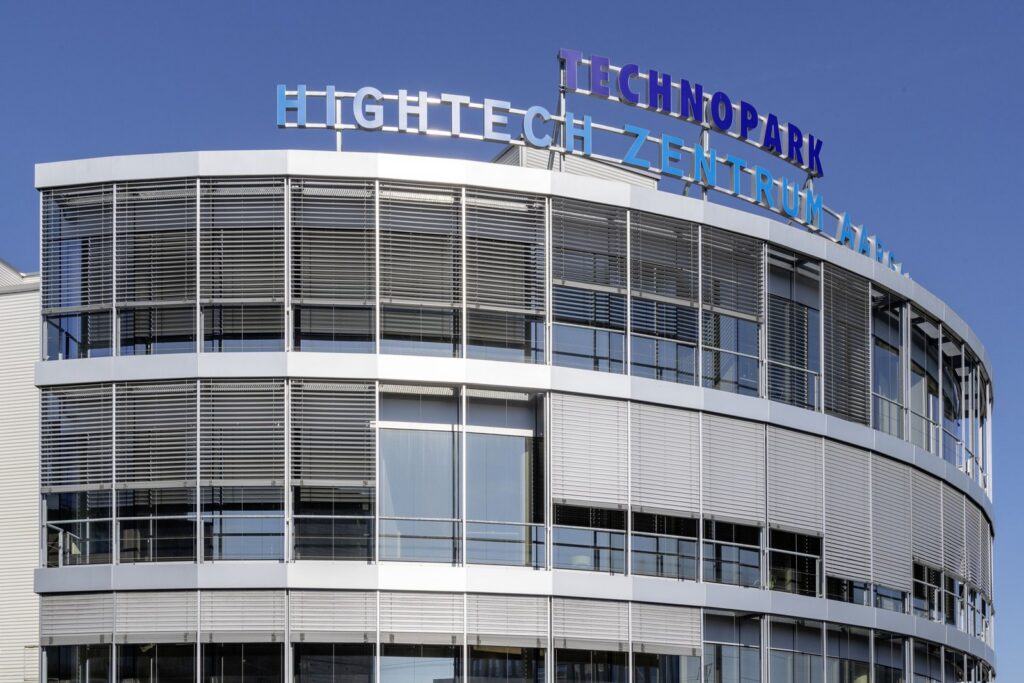
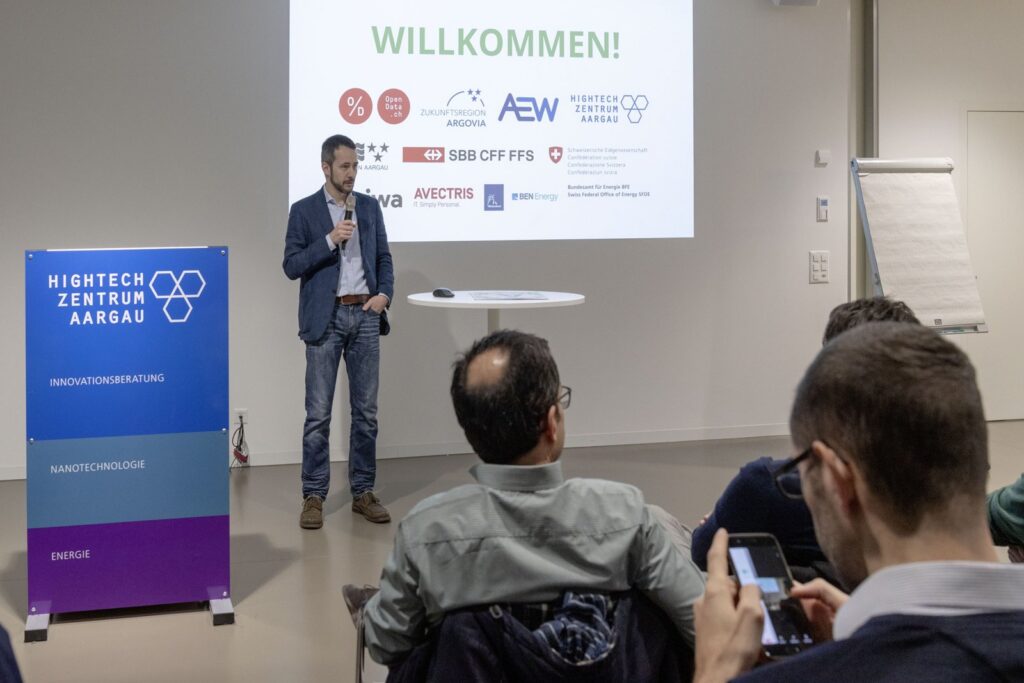
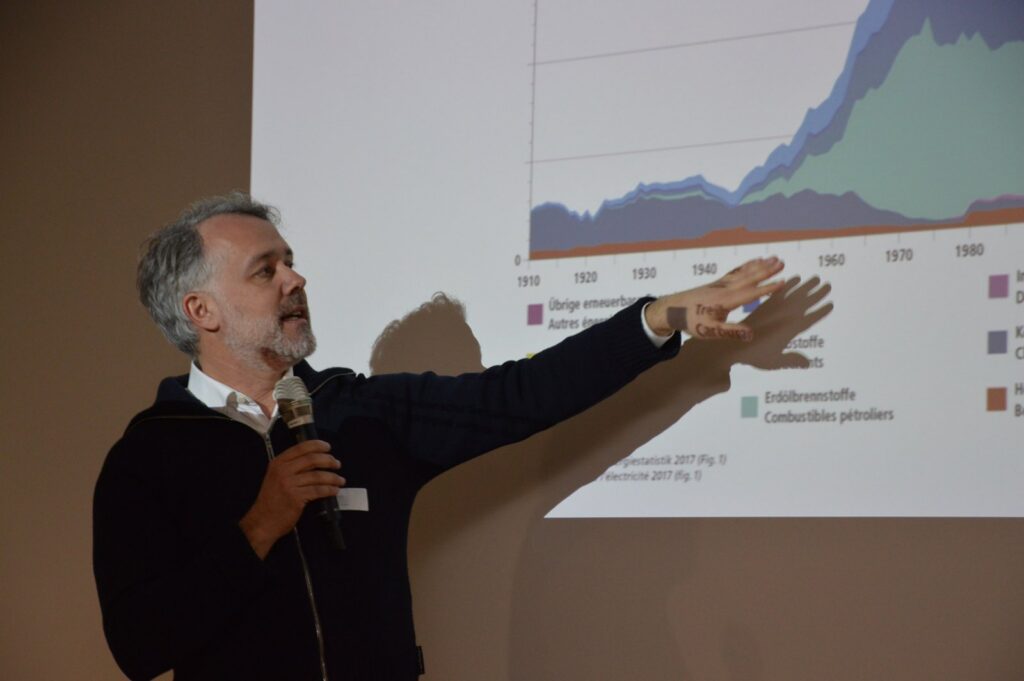
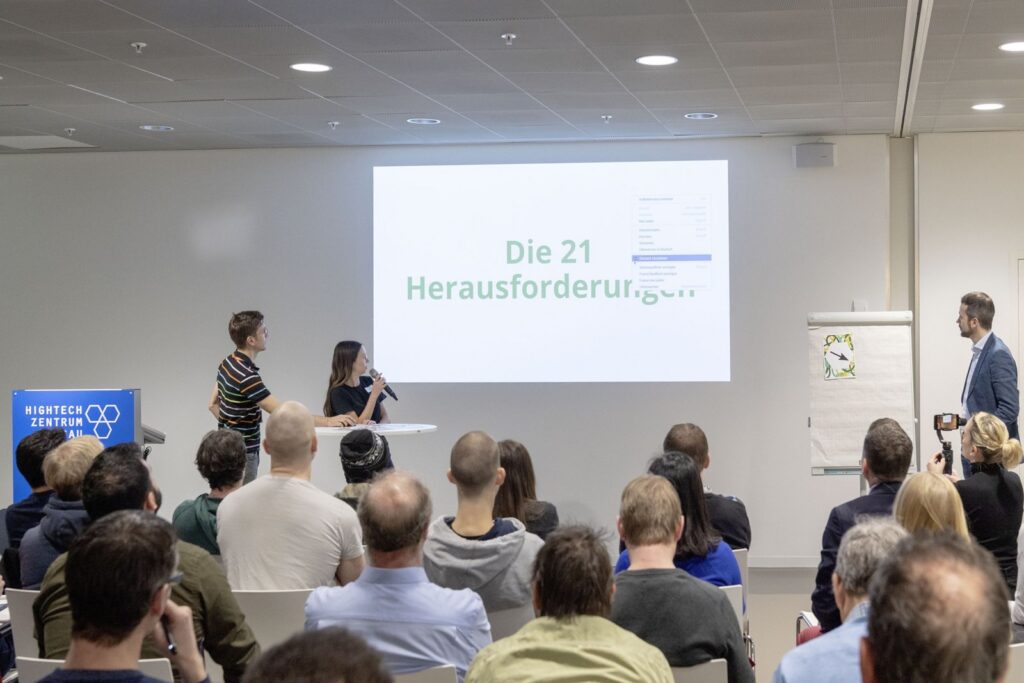
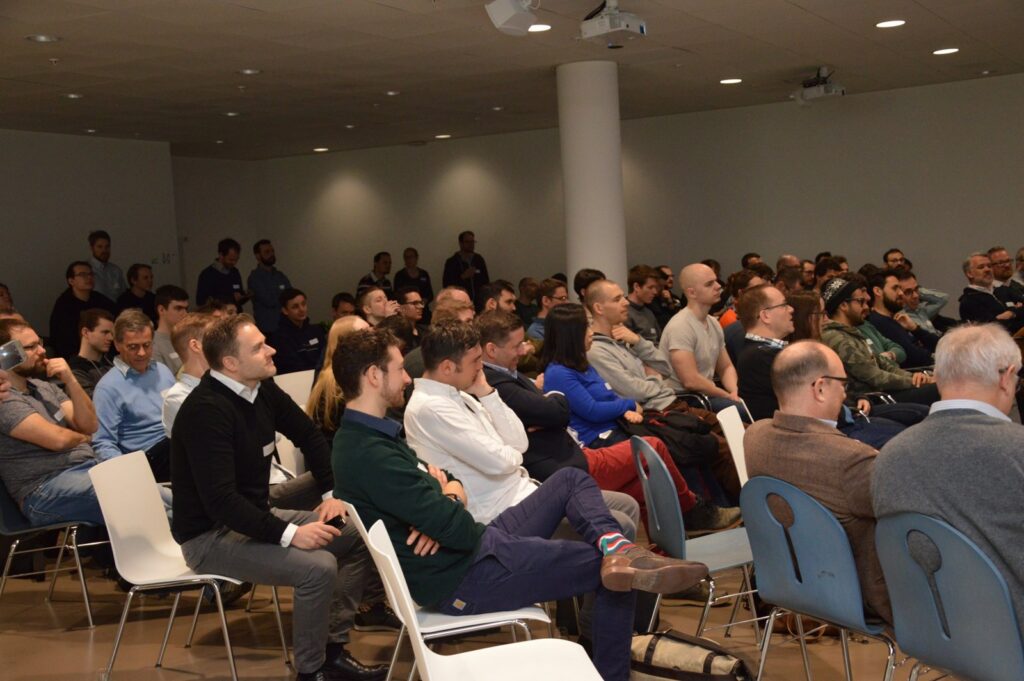
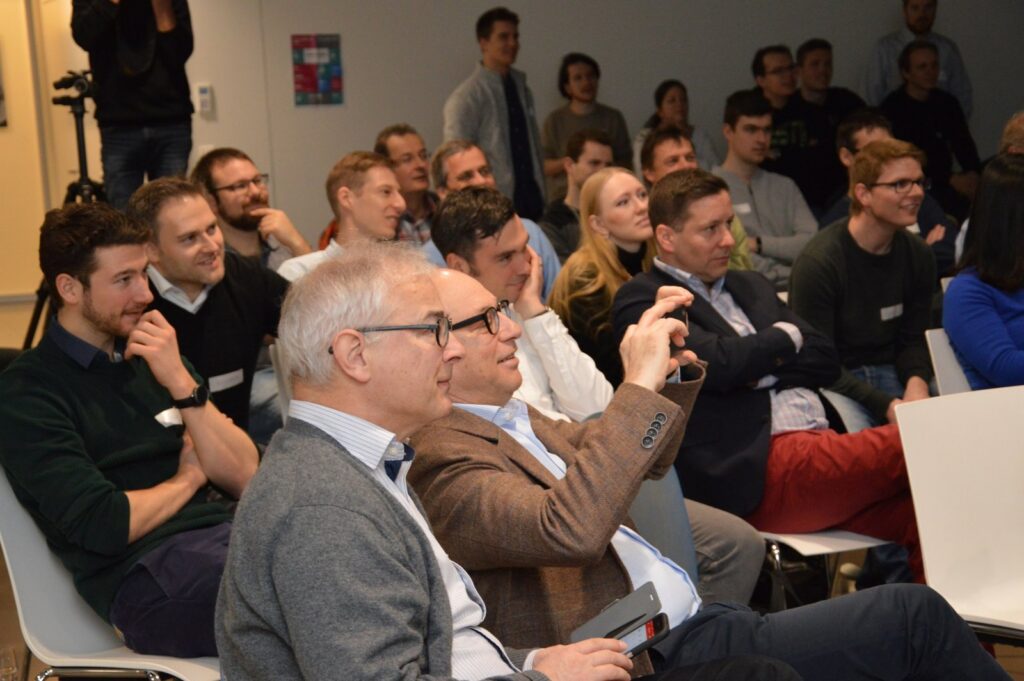
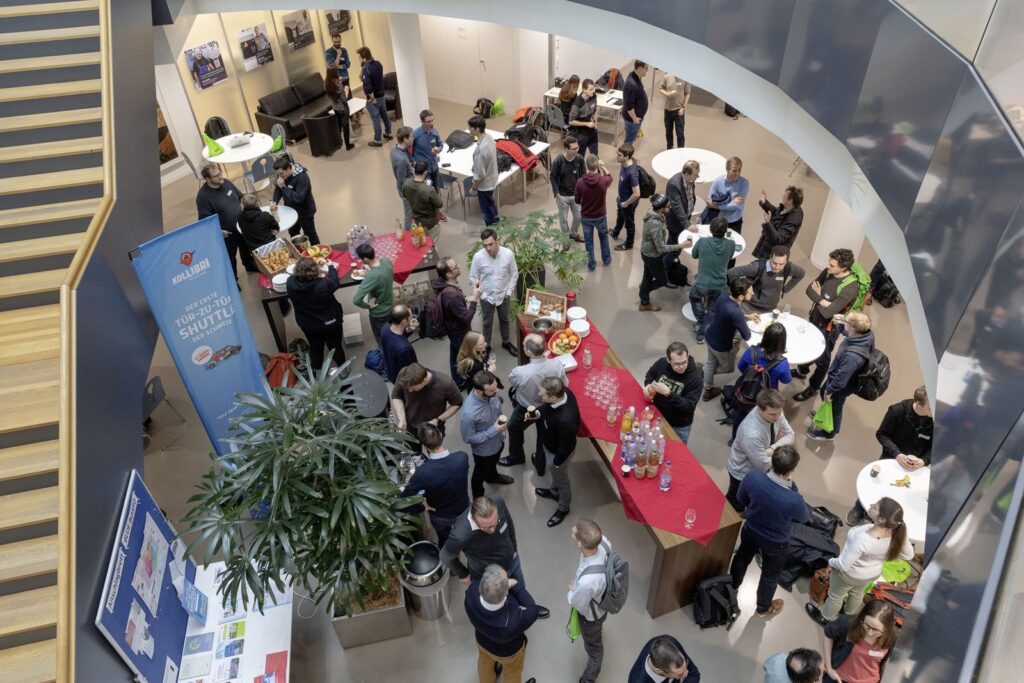
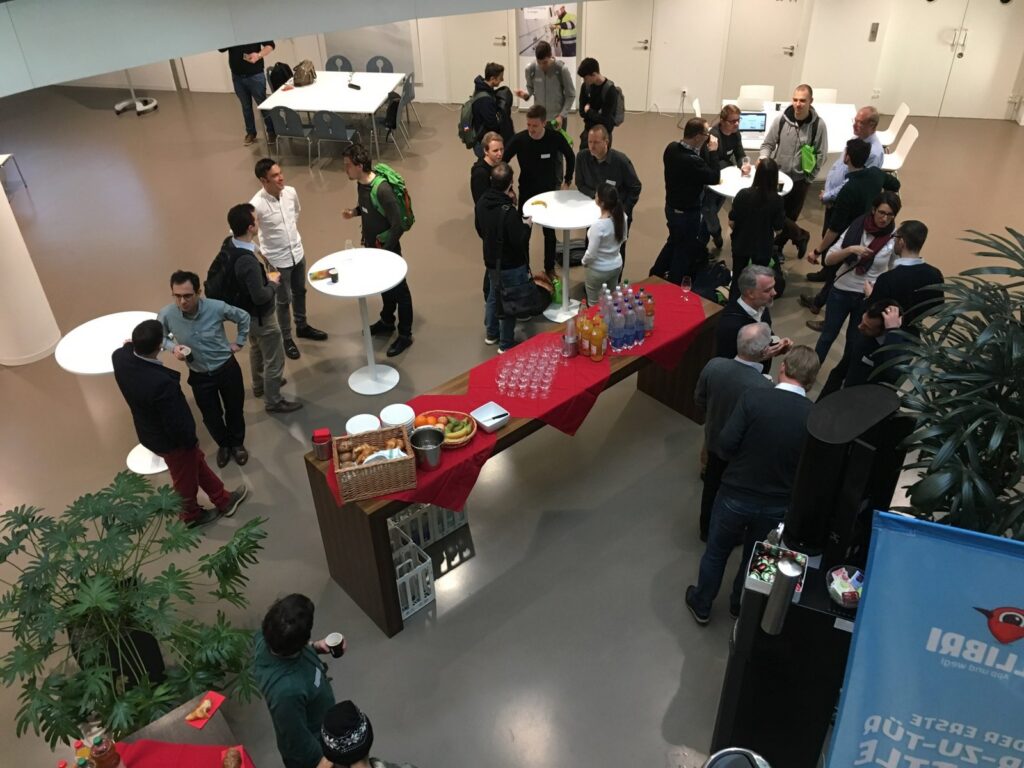
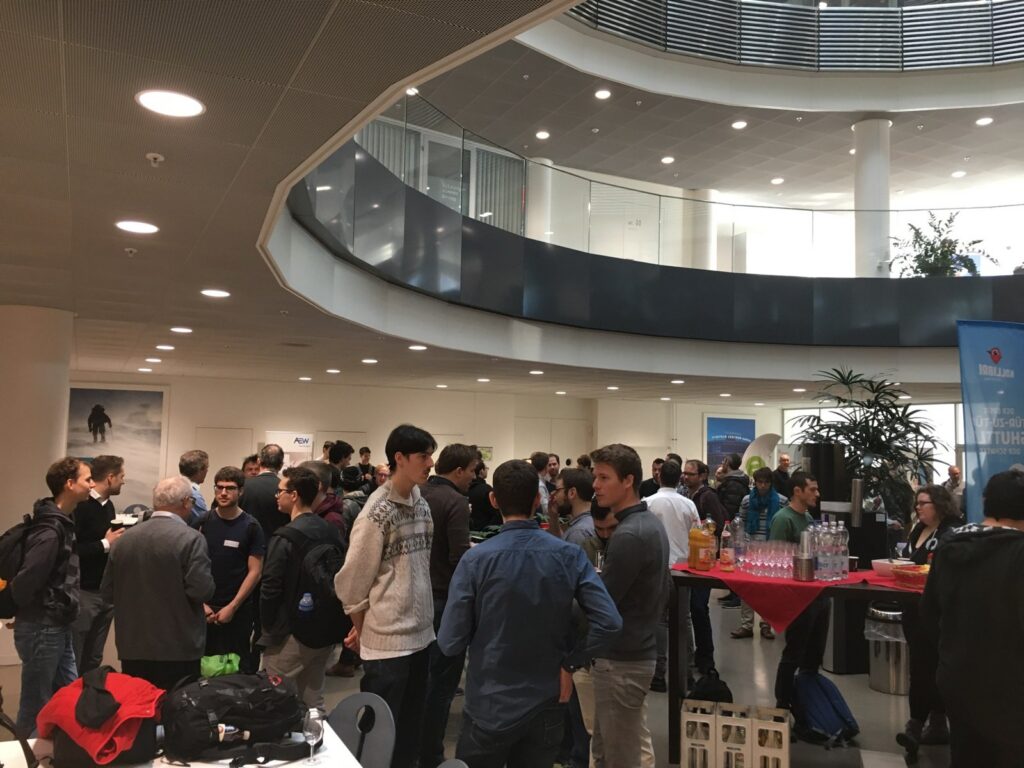
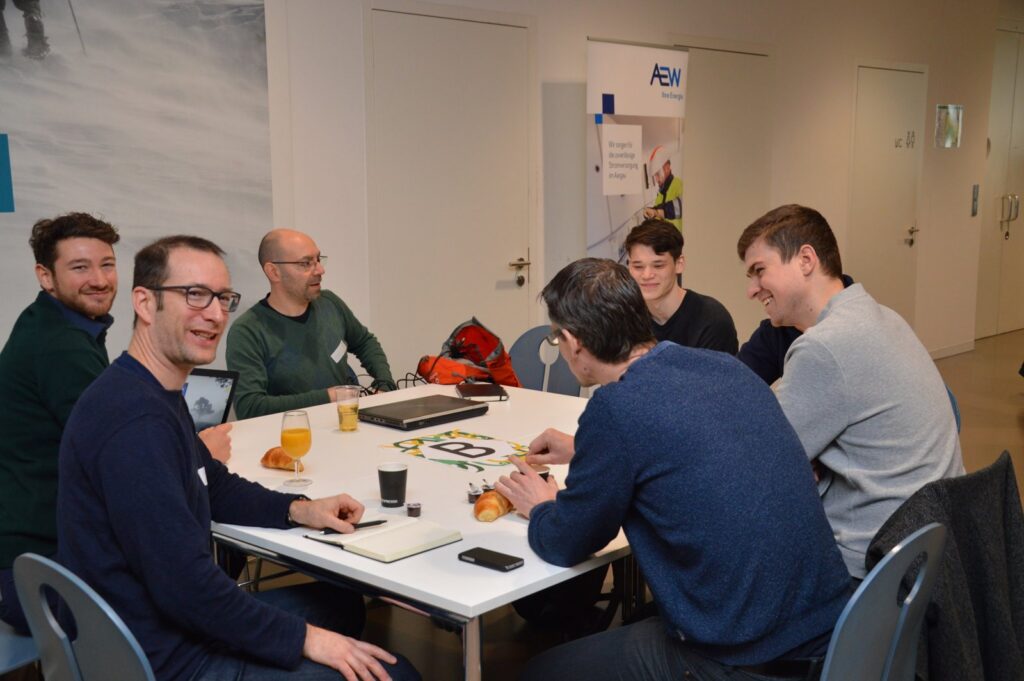
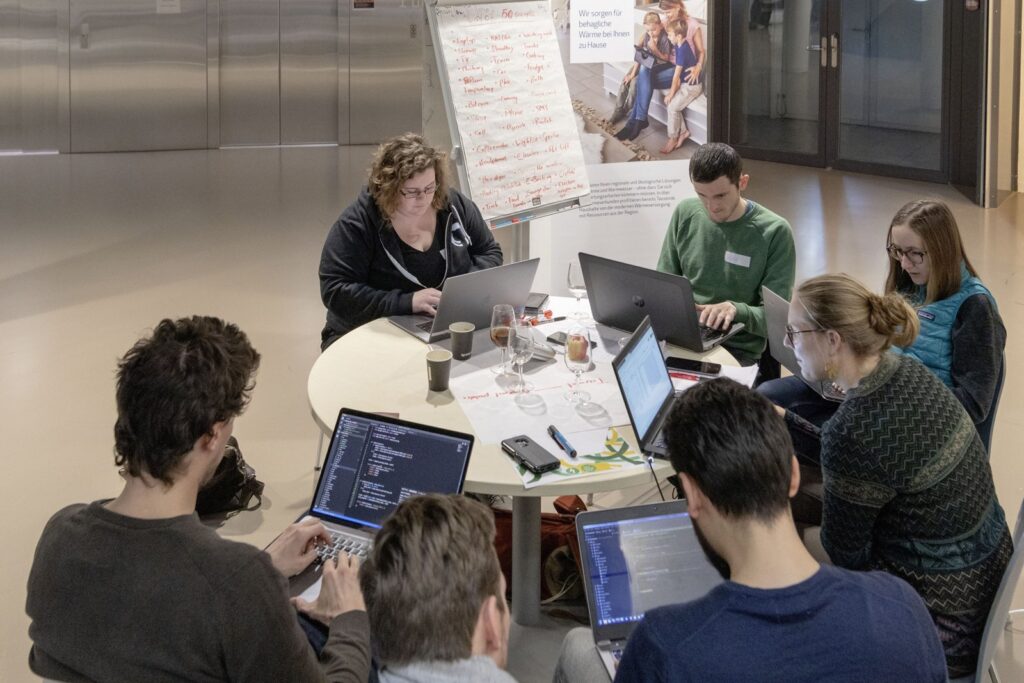
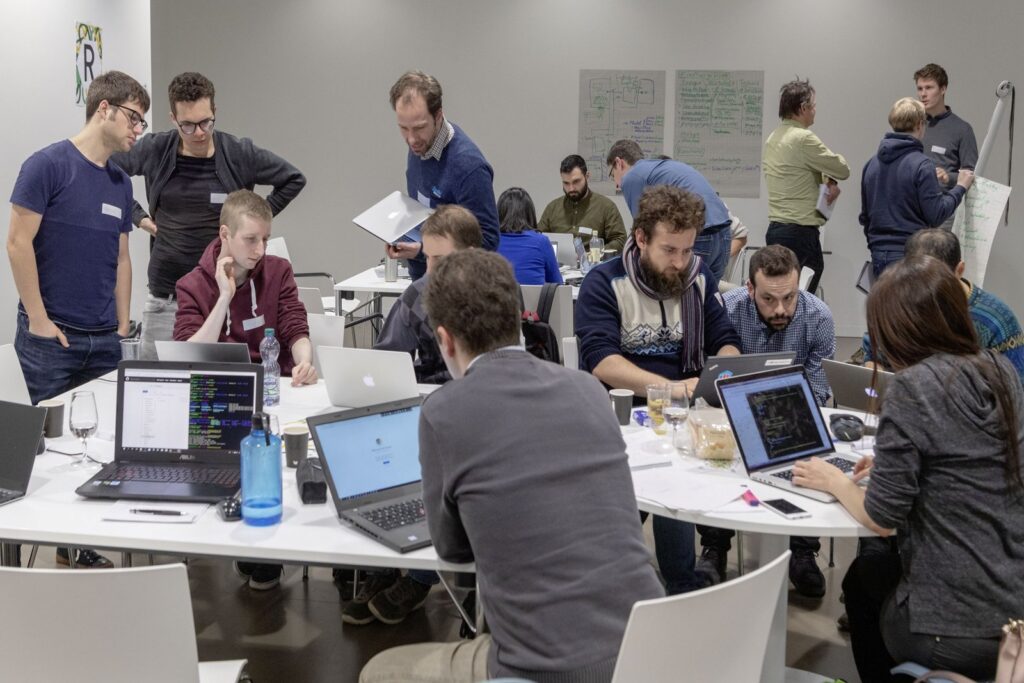
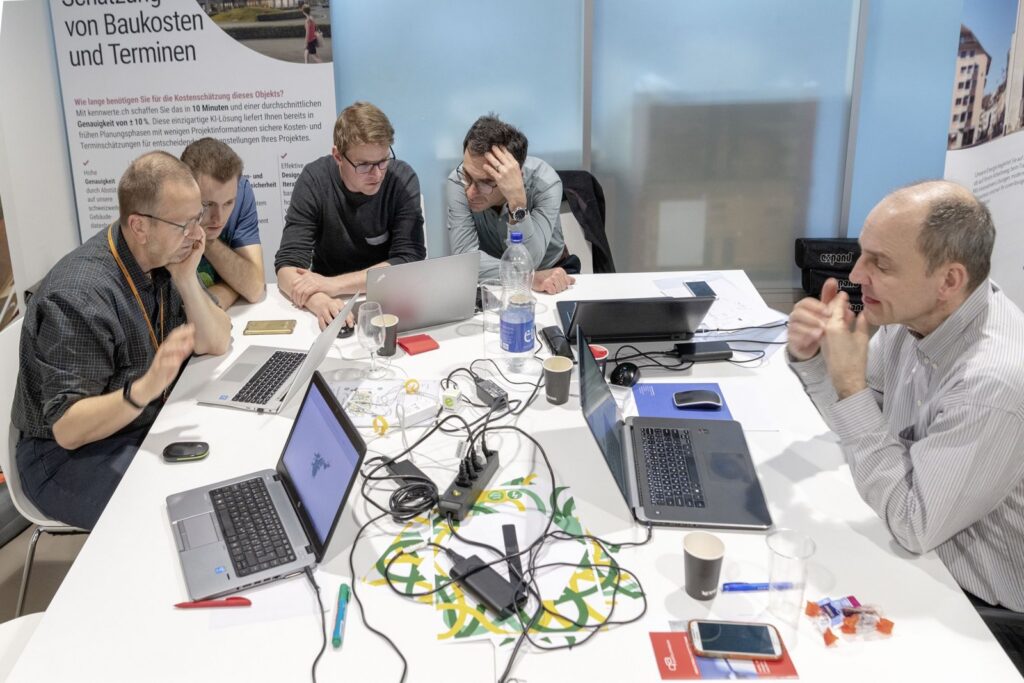
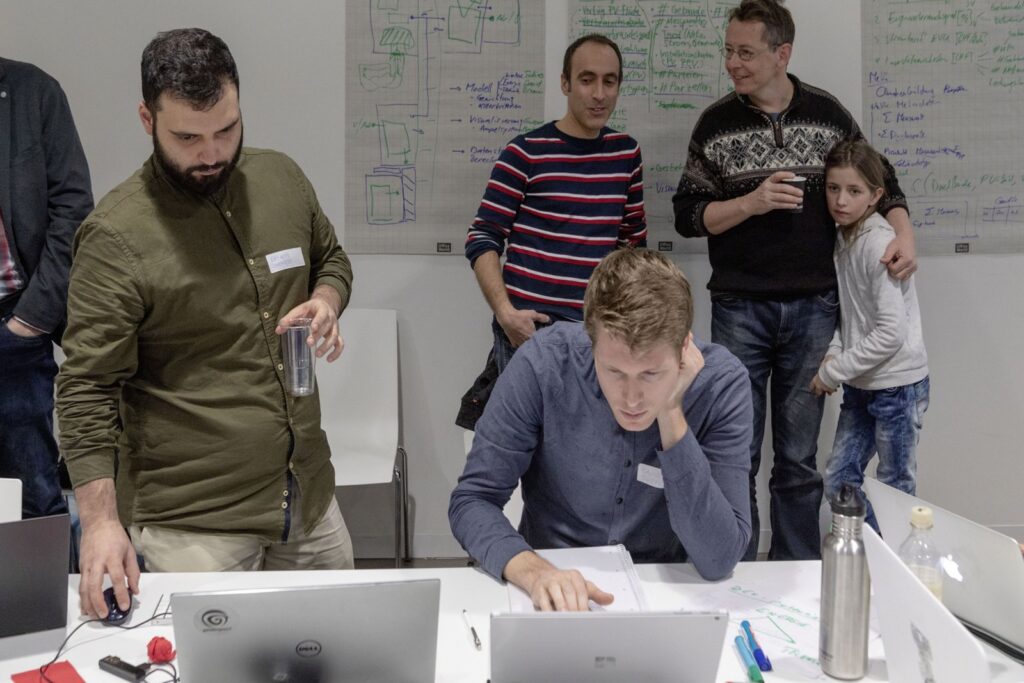
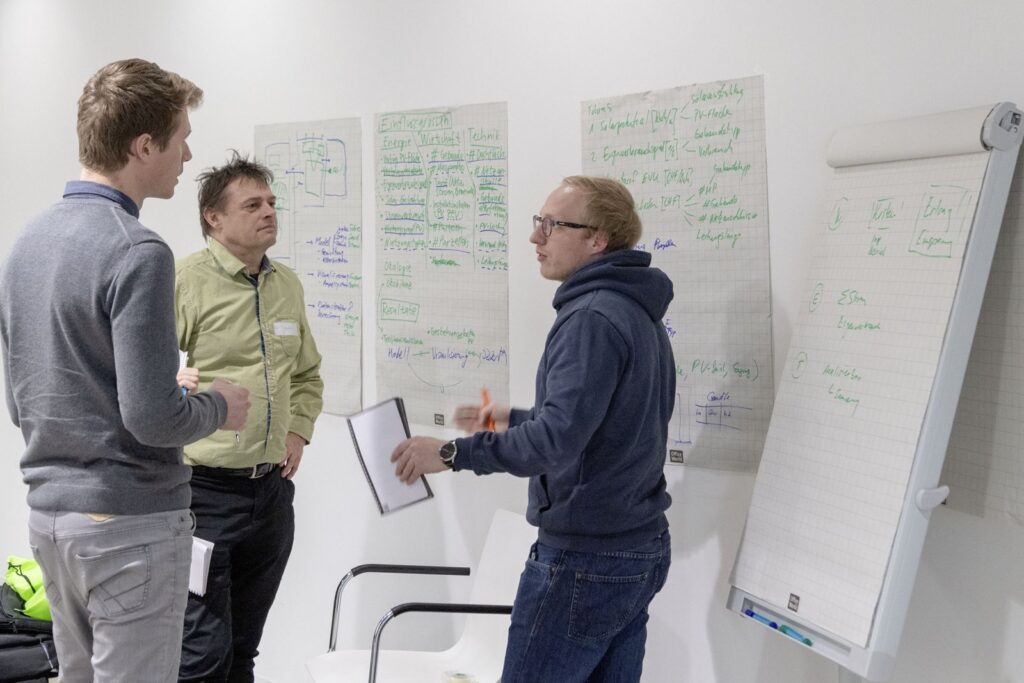
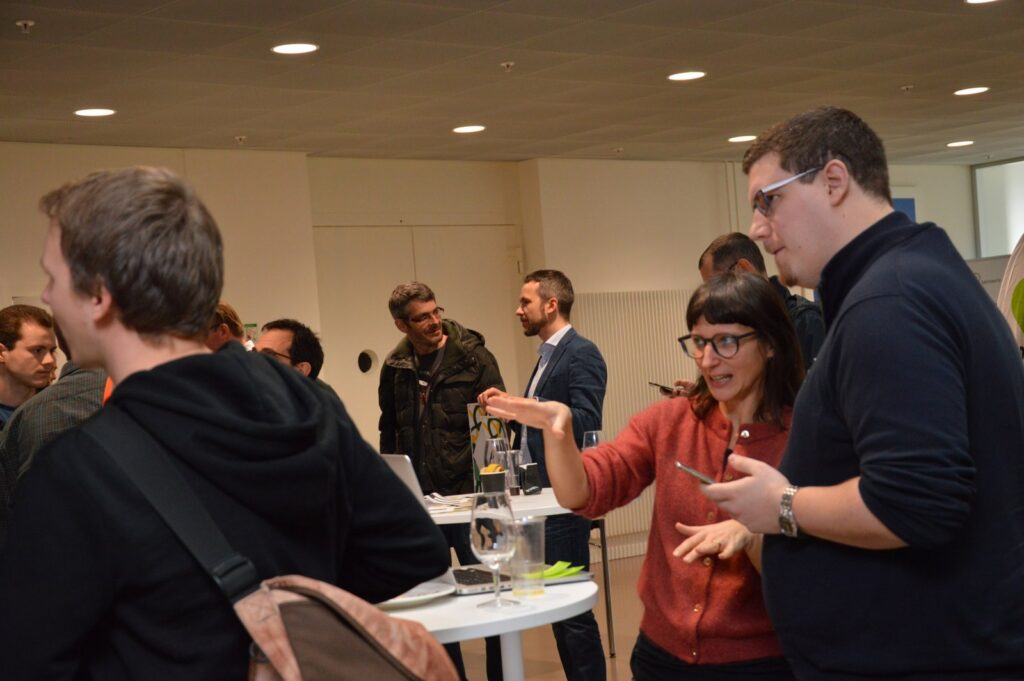
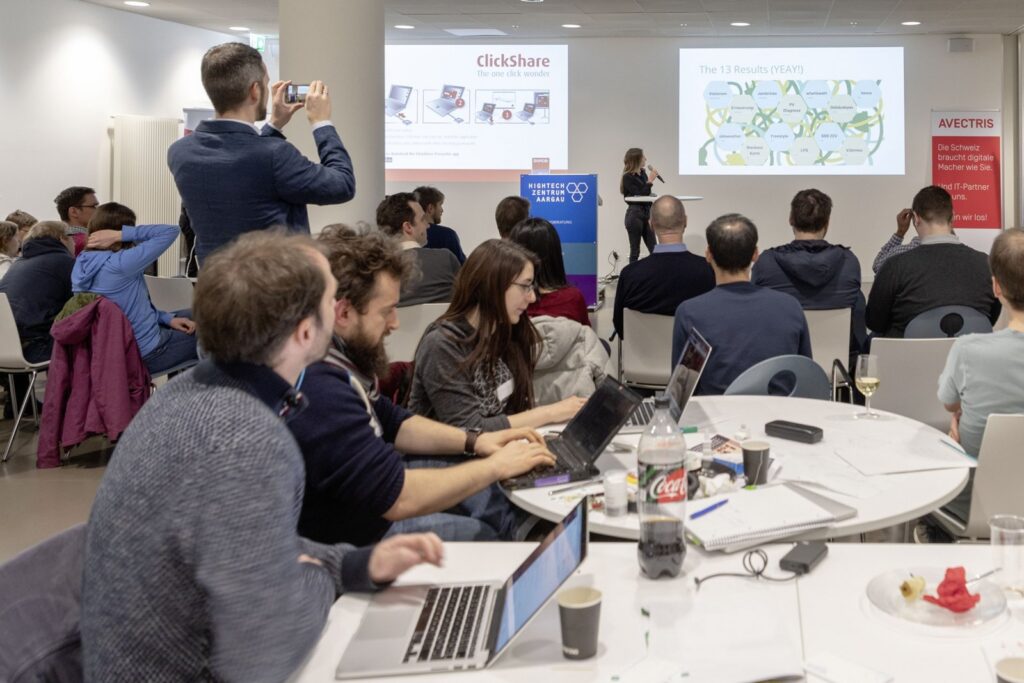
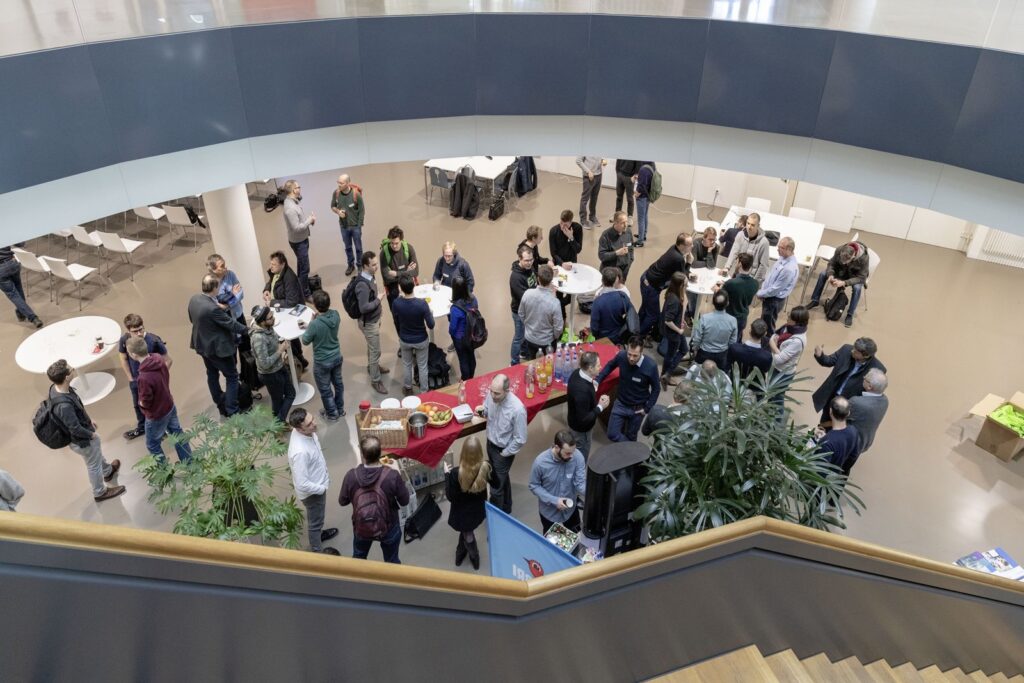
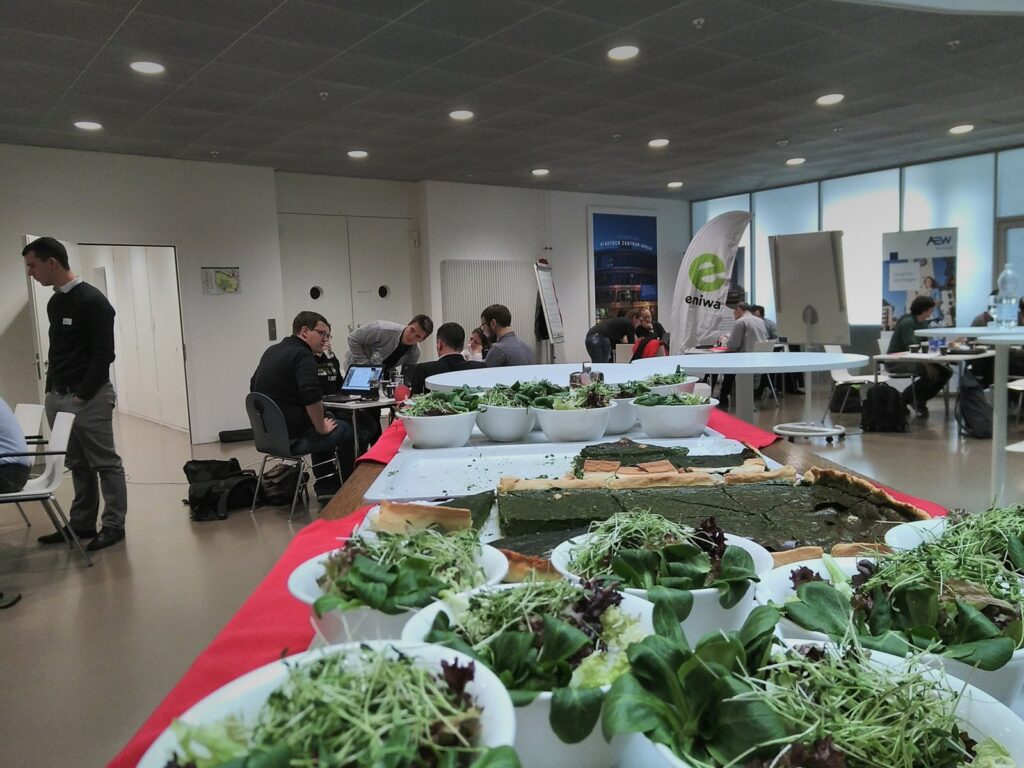
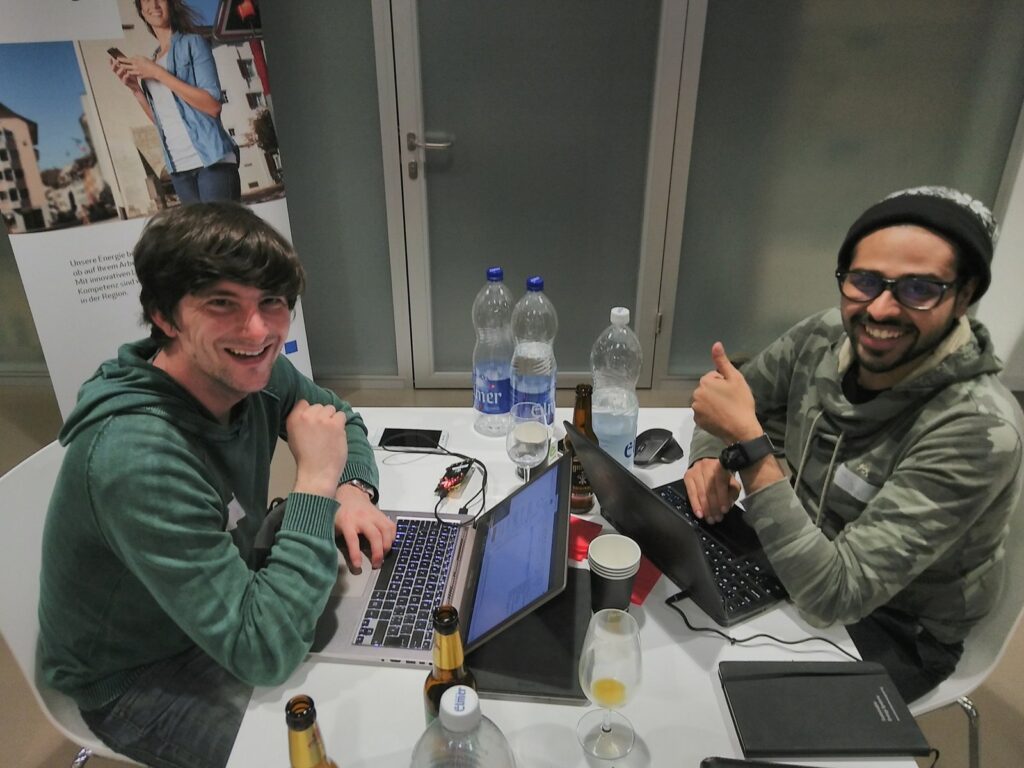
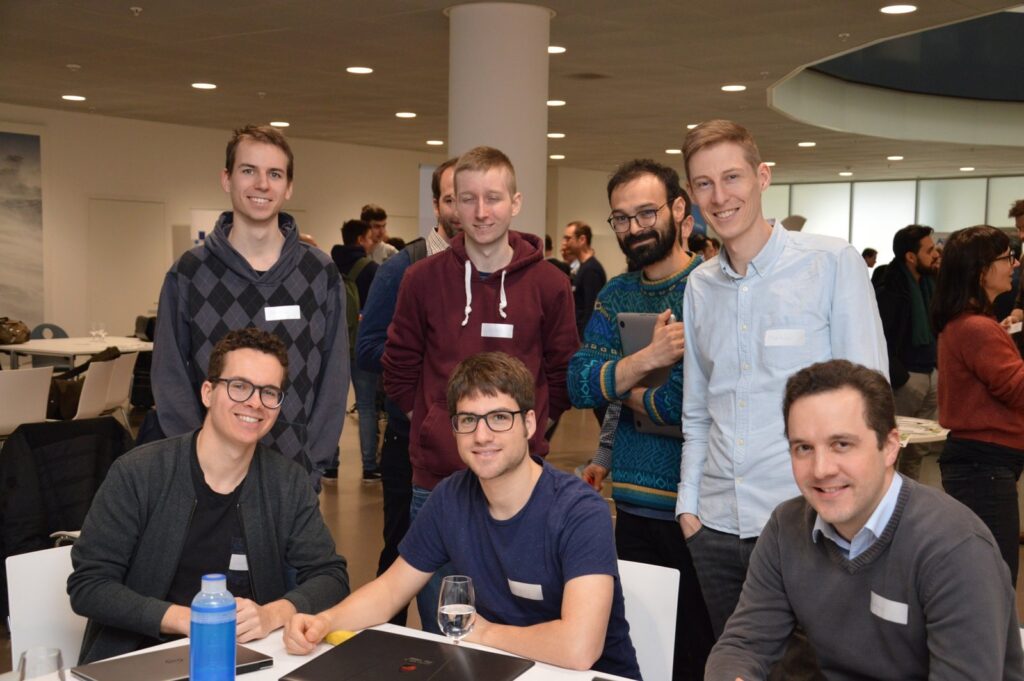
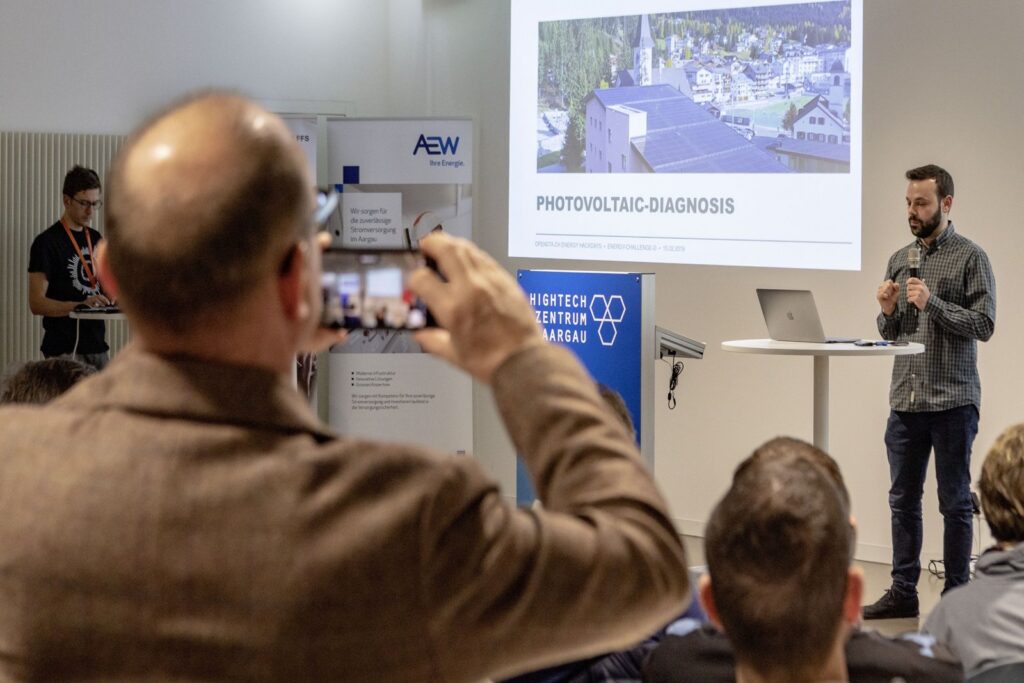
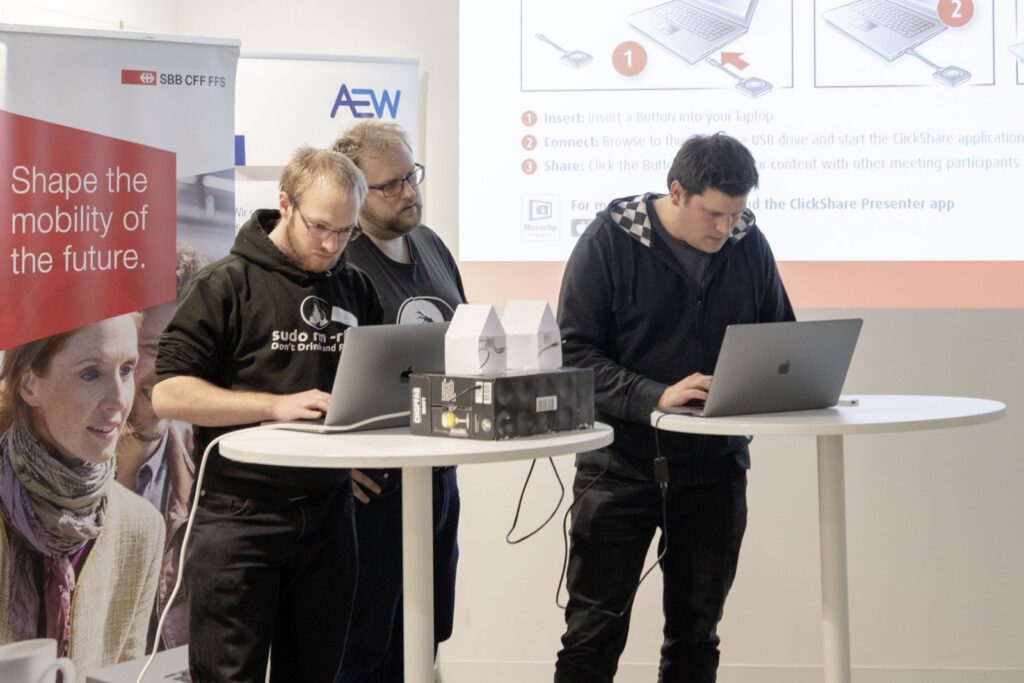
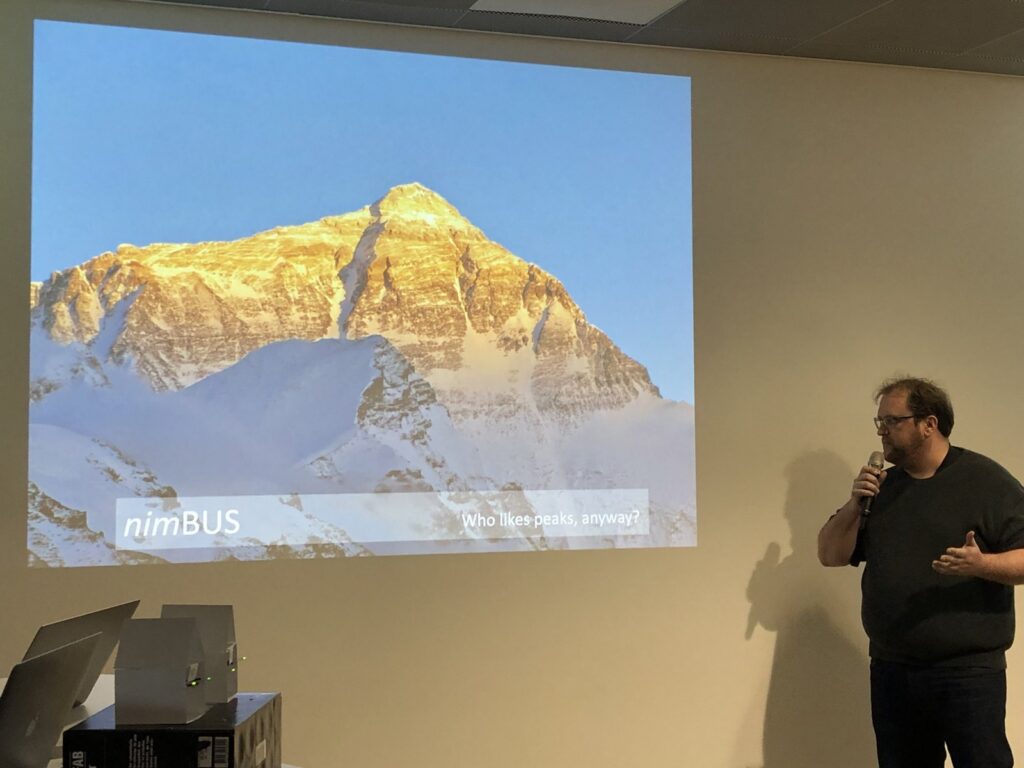
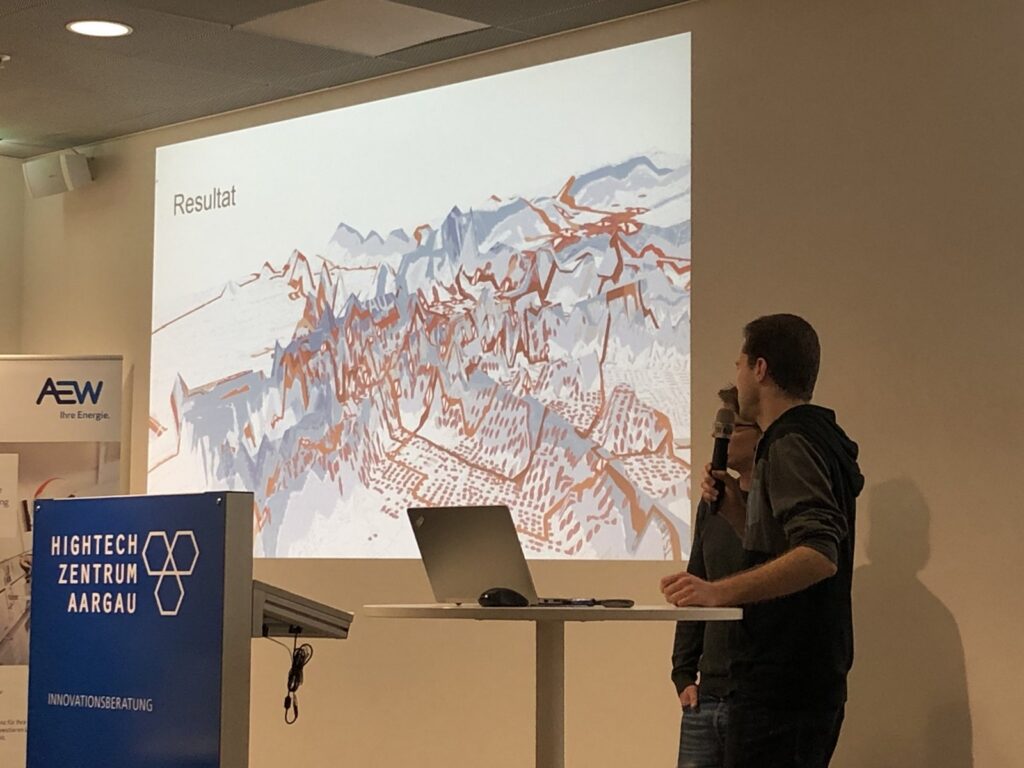
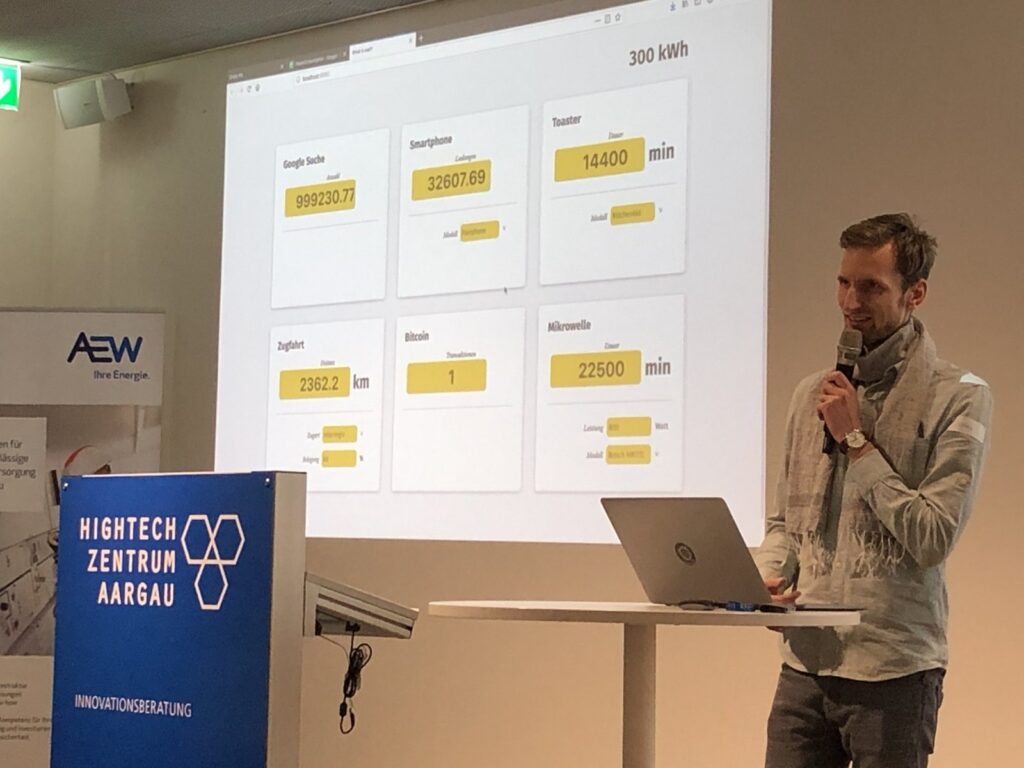
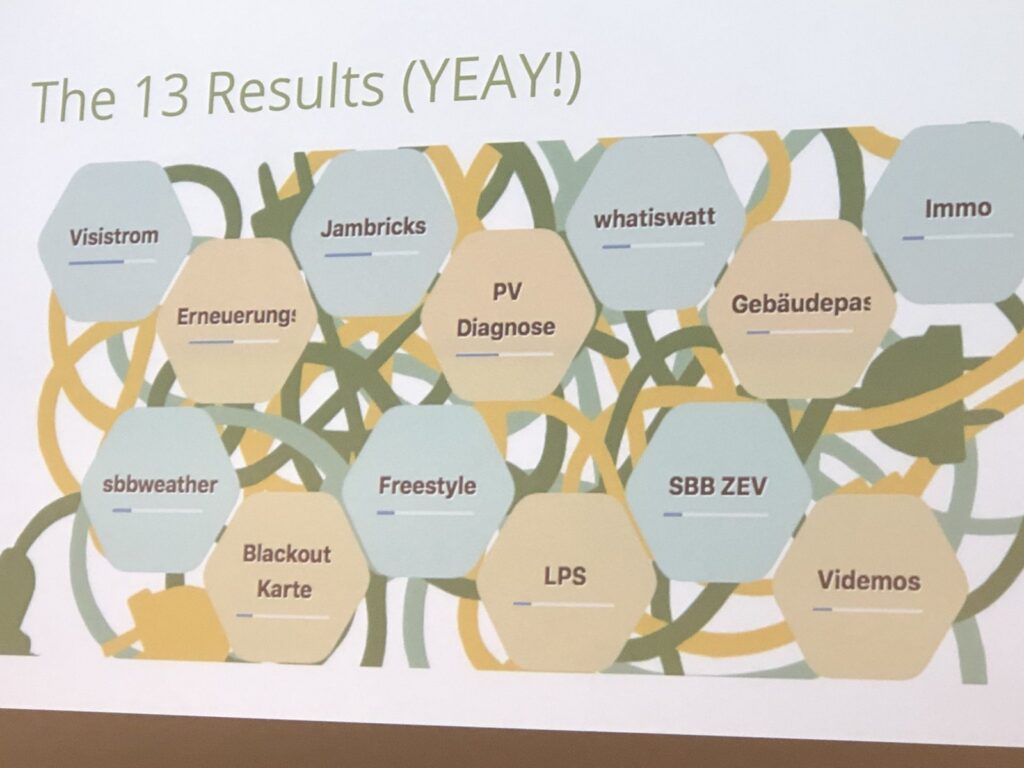
Photo: Magazin aargau einsA, Opendata.ch, AEW Energie AG, Oleg Lavrovsky, Hightech Zentrum Aargau
Documentation et enregistrements
- «Gemeinsam und öffentlich gestalten wir die Energiezukunft der Schweiz» (Opendata.ch, 21.2.2019)
- Projekte und Challenges auf der Hackathon-Plattform
- «#energyhack2019» – Rückblick von Oleg Lavrovsky (log.alets.ch, 22.2.2019)
- «#helloworld» – Gastbeitrag des Teilnehmers Raffael Krebs (log.alets.ch, 25.2.2019)
- Medienmitteilung AEW, Dezember 2018
- Offene Energiedatensätze für die Hackdays (datapackage)
Défis
- Visistrom
Using electricity at the right time help to avoid unsustainable sources
- Algorithmische Erneuerungsplanung
Value consequences in maintenance infrastructure for power supply
Description du défi
Challenge
Erneuerungs-planung
Objectives
Wert von der Standhaltung und die Folgen von Infrastrukturhaltung.
Topogie und Geometrie von der Betriebsnetz rekonstruieren.Process
Based on existing Geodata a graph-based model was made.
The optimisation algorithm was applied to find an optimal path.Data
Challenge_Unterhalt_Ausbau
Shape data format .shp
Excel data over energy consumption per dwelling or commercial propertyTools
This team analysed the value and importance of infrastructure maintenance work, using following tools → QGIS, rhino, grasshopper, mapbox, jupyter notebook (used libraries are to be updated).
The Slack channel #energy-plan is used for communication.
Results
Optimisation Algorithm was applied over a graph for finding the required maintenance root.
Formed a working version on the GitHub
Team
Members are @wolfram and @dimi
- Videmus
Strengthening citizen participation in damage reports
Description du défi
Videmus is a tool to develop a citizen participation for energy-related damage reports. It aims to allow citizens to easily report if they perceive a damage or potential point of improvement in their "energetic" surrounding.
Friday update: In the start phase we found that similar tools exist already and that it wouldn't make sense to program this tool again. Instead, we looked at business model and potential pain points in order to plan the implementation of such a tool. The idea now is to pool public utilities and find a business case for a potential startup.
Challenge : Bürger-partizipation
- Freestyle
Gamify your Electricity Usage
Description du défi
Freestyle is an app that helps people use energy in time periods that are less burdened.
Wir sind nur zu 3. Wir möchten einen App machen zum Zeitperiode lenken die auf der Kurve nicht so belastet sind. Wir haben verschiedene Geräte die nicht der ganzen Tag laufen müssen. Unseren Tool soll erlauben EV einzugeben und plannen, und die Kurve abzugleichen. Gamification kommt darein. Wir sind daran die Infrastruktur aufzubauen, den App zu schreiben, schauen was passiert.
Challenge
Gamification Verhalten
Code
https://github.com/lichtwellenreiter/eh_app
- What is Watt
What is Watt helps individuals to understand the energy need of different devices and activities.
Description du défi
Gut gemeinte Ratschläge sind weit verbreitet, wenn es darum geht Energie zu sparen. Aussagen wie «Lösch das Licht, wenn du den Raum verlässt» oder «Du musst ja für ein Stockwerk nicht den Lift nehmen» sind gut gemeint. Die Ratschläge umzusetzen, ist jedoch immer mit einer Verhaltensänderung verbunden. Die Erfahrung, wie schwierig es ist gute Vorsätze umzusetzen zeigt: jede Verhaltensänderung ist teuer.
Demo : https://jonasoesch.ch/content/work/what-is-watt/v2/
Challenge: What is Watt setzt einen Schritt vor dem Ratschlag an. Das Projekt hilft bei der Entscheidung, welche Verhaltensänderungen sich wirklich lohnen. Damit auch die eigene Energie effizient eingesetzt wird.
First Update
Right now we came up with the idea of having a map of all kinds of different things you can do with energy in your daily life. We want to let people explore this map of stuff, and to see how everything is related to everything. It is an ambitious goal which we will never reach this weekend. Still we think we will reach it, and will do our best. The data is available for most things, it's going pretty well. I hope we see some results in the next few hours.
Second update
We have overhauled the interface and created a next iteration of the webapp:
https://jonasoesch.ch/content/work/what-is-watt/v2/
Data
Daten (Google Spreadsheet)
Source
- Jambricks
Plug n' play on your hackathon way!
Description du défi
This project devises a fun way to investigate the equipment that people bring to a hackathon, and provoke conversation about energy usage and standards.
How to
- Bring a kitchen scale to the hackathon, or find one on location
(Thanks, Bernhard!)
((The Micro:bit is just for decoration - bonus points for using a smart scale!))
- Collect the data in some way. You can use our proto-app, for instance.
--> JamBricks App <--
NB: the data is not yet saved anywhere except on your own computer!
- Measure the Weight (in grams) of every participant's power supply and read the Wattage from the label.
Pro tip: if the Wattage is not stated, multiply the number of Volts by the Amps, e.g.:
19.5V x 3.34A ~= 65W
- Copy and paste the resulting totals on your project page, and ask the other teams to do the same!
For example, you would get something like this:
Show me the data
You can find a table of all of our results from #energyhack19 here (GitHub)
We dragged a total of 12.0 kg of power supplies rated a total of 3'890 W across all 59 people surveyed. Some people did not have a PSU and seemed to last the hackathon on a battery charge - what's your secret?
Congratulations to Andreas for bringing the "heavy" to the Hackdays, a 435 g brick, which also is the highest rated we found at 148 W.
Wait, but why?
Laptops and other mobile computing devices are a prerequisite of hackathons. You could support your team's design efforts with a pad of paper and pencil, and you should - but most people would feel left out if they came to a coding party without their devices.
People bring all kinds of hardware to hackathons. Back in the days of the LAN party we used to bring whole PCs and bulky monitors on site. These days we might do well to do our coding for the weekend on an tablet. In sports, people pay attention to the "hardware": the shape and size of bicycles or skis , for instance.
We have never thought about the power consumption figures of our computers before - but today the issues of the excessive energy consumption of IT projects is a topic of public concern (WIRED). Some people complain about their heavy power supplies, and we started wondering why Smart Homes and Offices don't have DC plugs, and got into a bit of the history of (the lack of) electricity standards.
With this project we aim to provoke some conversation about an overlooked element that may contribute to successful collaboration.
Inspirational quote
It would be quite possible to devise a universal DC outlet that depended on an ID signal from the device being supplied, either from its cable or the from the device. This only needs to be a unique ID. As we only need a small range of voltages, typically from 3V to 24V we wouldn’t need a complex code. An intelligent adaptor in the outlet would then set the voltage needed by that device. In a way this is done already with the plug and socket combination identifying the voltage. This also shows up the weakness of a smart outlet. You only need a lightweight connector for a device drawing small currents (e.g. Micro-C USB), but something more substantial would be needed for devices like printers and monitors that might draw peak currents of two or three amps. Perhaps two different sockets, one for low, and one for high power would be acceptable.
-- Rob Gillatt, Electronics Engineer via Quora
Credits
The web application is made with Vue.js based on the TodoMVC boilerplate. You can fork the source code at JSFiddle .
Inspired by crowdsourcing data from participants, by physical hackathon projects like Aufschnitthilfe , and by midnight reading about the reasons we cannot plug our devices directly into wall sockets.
🧱 3 bricks | 155 W | 261 g
- Ladestationen-Standortplanung
A view on the future of planning
Description du défi
Projektziel
Planungshilfe für neue Standorte von E-Mobil-Ladestationen, die öffentlich zugänglich sind.
Analyse der Ausgangslage und Formulierung der Fragestellung
Die unterschiedlichen Stakeholder (Verteilnetzbetreiber, Gemeinde, Nutzer eine Elektromobils) wurden analysiert und deren Anforderungen an Standorte für Ladestationen formuliert. Anschliessend wurden die Nutzungsformen (Private Nutzung für Einkaufen, Besuche / Arbeitsnutzung zum Pendeln oder Kundenbesuche / Freizeitnutzung für Ausflüge oder Reisen) der unterschiedlichen Nutzer (Familien, Einzelpersonen, Paare, ältere Personen...) unterschiedlicher Wohnformen (Einfamilienhaus, Mehrfamilienhaus, Eigentum oder Miete, städtisch oder ländlich) mit unterschiedlichen Mobilitätsformen (Privatauto, Miet- oder Sharing-Auto, Velo, Zug oder Tram/Bus) analysiert. Dazu könnte eine detaillierte Informationendatenbank aufbereitet werden.
Prototyp
Nach der Betrachtung vorhandener Daten und möglicher Umsetzungen aus Sicht der unterschiedlichen Stakeholder wurde für dieses Projekt beschlossen, dass ein Prototyp einer GIS-basierten Planungshilfe für Gemeinden erstellt wird. Mit der bestehenden Datengrundlage für den Kanton Aargau wie öffentlich zugängliche Ladestationen, Park&Ride Standorte, Park&Pool Standorte und Parkplätze des Tiefbauamts kann die Karte analysiert und Indizien für zusätzliche Ladestandorte eruiert werden.
Weitere Bearbeitung des Prototyps
Was zusätzlich eingebunden werden könnte: visualisierte Pendlerströme, Hauptverkehrsachsen (als Heatmap), SBB-Bahnhöfe, Standort von Trafostationen, Standort von PV-Anlagen, Standort von Batterien, bestehende (konventionelle) Tankstellen, Auslastung (Anzahl und Dauer der Parkplatznutzung, Anzahl und Dauer der Ladevorgänge) der Ladesäulen...
Teamwork
Unserer Team ist Freitag leider von 6 auf 3 geschrumpft. Ein Grossteil der Zeit wurde verwendet, die Fragestellung zu diskutieren, den UseCase einzugrenzen und vorhandene Daten zu finden. Am Samstag haben wir den Prototypen umgesetzt und das Projekt dokumentiert.
Challenge
Standort planung
Data
https://www.bfs.admin.ch/bfs/de/home/statistiken/mobilitaet-verkehr/personenverkehr.html
Netzbetreiber Aargau
Park & Ride Aargau
Park & Pool Aargau
Parkplätze Tiefbauamt Kanton Aargau
🚧 Under Construction 🚧
- sbbweather
What influence does the weather have on your train journey?
Description du défi
This team is analysing fresh SBB weather data.
Challenge
Welchen Einfluss hat das Wetter auf deine Zugfahrt?
Data
Statt teuer Wetter Daten einzukaufen, könnten die Daten vom Integrated Surface Database (ISD) des amerikanischen Wetterdienst bezogen werden. Enthalten sind hier die historischen Stundenwerte aller Wetterstationen weltweit. Die Daten sind frei verfügbar.
First Update
We are working with SBB weather data, did some wrangling and found some outliners which they were very thankful for - e.g. some trains which ran 1 km per second. The data is 2GB of 5 minute periods for one year, it's in a separate file to the track data. Still struggling with that, but we have some models we are planning, and ran some already on the data. We'll see what we can build by tomorrow.
Energielast Tool
Für einen produktiven Einsatz bei den SBB könnten die Real-Time Daten von MeteoSchweiz (Open Data) eingebunden werden. Es könnte dann der Energieverbrauch berechnet werden. Ein sehr einfachen Prototype findet sich unter http://hackday.nemundo.ch
- Blackout Karte
Identify causes of blackouts in networks
Markus JungDescription du défi
Challenge
Link to presentation (PDF)
Link to QGIS Projekt including Layers
- Gebäudepass "Cloud"
Solutions for a Building Passport
Description du défi
Gebäudepass is developing a "building passport" that documents and portrays all relevant energy-related information about a building. The goal is to develop a concept that helps the state, canton, municipalities and / or cities to evaluate their state and needs when it comes to buildings.
Challenge: Gebäude-pass
Demo: abdagon.wwwnl1-ls3Challenge Ergebnisse
Die Ergebnisse sind in einer Präsentation und deren Anhang dokumentiert, inkl. Visualisierungen (siehe oben)
Research
In Europa bestehen viele Studien und Projekte für Gebäudepässe (Präsentation Anhang)
Für Gebäudesanierungen existiert eine ausgereifte Lösung eValo
Viele Daten existieren, sind aber nicht zugänglich
Potentiell verfügbare Daten für Gebäudepass "Cloud"
GWR (Gebäude- und Wohnungsregister)
EVU CRM, Leitung-Kataster, ...
Sonnendach
Erdwärme
Feuerungs Datenbank
Pro Novo (SwissGrid Photovoltaik)
Evtl. dynamische Messdaten (Strom, Heizungsrechnung)
Datenhack Raumwärme Aarau
GWR enthält potentiell viele Daten, darf jedoch nicht in vollem Umfang genutzt werden - der Datenhack war auf Raumwärme und Warmwasser Aarau beschränkt
Gebäudepass «Cloud» - Zielsetzung
Nutzung existierender Daten – Vermeidung von Mehrfach-Erfassungen
Plattform für Energie- und Investitions-Optimierung für Gebäudebesitzer, Gemeinden, Kantone, Bund, Energieversorger
Nutzung ergänzender Daten für plausible, konkrete und frühzeitige Optimierungs-Vorschläge (z.B. Verfügbarkeit Gas, Fernwärme, ...)
Prozesse (inkl. Validierung) und Anreize (z.B. Steuererleichterungen) für hohe Datenqualität
Gebäudepass «Cloud» - Nutzen
Gebäudebesitzer
Vorschläge für Sanierungsmassnahmen
Business Cases für Energie Optimierungen
“Preventive Maintenance”
“Logbuch” für Sanierungen
Dokumentation für Verkauf
Gemeinden, Kantone, Bund, Energieversorger
Verbesserung Datenqualität mit Bevölkerung
Energieplanung
Umsetzung Strategie 2050
Validierung Förderungsystem
Quantifizierung
Simulation, Szenarien
Gebäudepass «Cloud» - Prototyp
Auf der CMS Drupal Plattform wurde mit einem Aufwand von ca. 1 Stunde ein einfacher Prototyp für einen webbasierten Prototyp entwickelt, um die mögliche Funktionalität zu demonstrieren. Eine solche Anwendung hat ohne Daten jedoch nur einen geringen Nutzen.
http://abdagon.wwwnl1-ls3.a2hosted.com/bp/web/
Gebäudepass «Cloud» - Erkenntnisse
Einzellösungen vorhanden
Fehlende Integration – Mehrfacherfassungen nötig 🤮
Teilweise ungenügende Datenqualität – fehlerhafte bzw. veraltete Daten
Sehr viele Daten existierend – aber in Silos und nicht zugänglich
Nutzung möglichst vieler bestehender Daten – mit kontrolliertem Zugang
Datenzugang mit Identifikation ermöglichen, Nutzung protokollieren
Gebäudepass «Cloud» - Projekt
Fokus Gemeinde – PoC Aarau , mit Zukunftsregion Argovia
Daten von GWR, EVU – eValo Anbindung
Zugang mit Identifikation (SwissID)
«Abfragen» für Nutzen Optionen
Erstes update
Wir haben uns überlegt wie eine Gebäudepass aussehen könnten, verschiedene Daten angeschaut. Es gibt in andere Ländern bereits Lösungen für den Gebäudepass - wir fokussieren uns um die Frage, wie wir an die Daten herankommt. 2 Problemfelder: die Daten sind z.T. nicht öffentlich zugänglich, auch wenn durch Steuer bezahlt. Was man zusammenkriegt genügt nicht zum zusammenzuladen. Wir haben den Gebäudepass gedacht für Gebäudebesitzer. Eine schöne Grafik wäre interessant auch für Bund, Kantone, Gemeinde zum gemeinsame Bilder von Bedarf zu setzen. Wir sind am abklären ein Projekt zu machen mit der Zukunftsregion Aargau. Wir haben uns gefragt wer und wo interessiert wäre mitzumachen. Stadt Aargau prüft schon ob sie könnten eine Proof of Concept machen. Wir überlegen uns wie das Projekt aussieht, und ganz schnell zu Prototypen kommen.
- PV Diagnose
An application for small scale PV owners to check whether their installation is still healthy.
Description du défi
We created a web app that allows users to check the status of their solar installations by evaluating if the energy production is at a normal state. Our application aims at providing a quick verification of the monthly energy production of rooftop solar panels. The user will provide the following input:
Location of the solar panel: address
Size of PV: area in m2
Capacity kWp
12 months of production data
The app looks up the estimations from sonnendach , compares the the input and returns:
Location on map
Status: ok or not ok
Monthly comparison of actual vs. reference as a bar chart
See our wiki for more information.
Here the web app prototype (1) user interface and (2) output results - bar chart and diagnosis
Team members: Tetiana, Adrian, Andreas, Angelos, Bogdan, Braulio, Daniel, David, Martin (@Mhertach) and Tobias
- SBB ZEV
Visualize the potential of different SBB buildings as self-powering communities
Description du défi
SBB ZEV aims to analyse the potential of different SBB buildings to become self-powering entities. In a second step, this evaluation will be visualised to make it more accessible.
Data & code: Notebook
Challenge: Max PV-Strom SBB-Arealen
- Load Profile Shaping
Lastgangskurven optimieren
Description du défi
Challenge (siehe Gamification Lastgang )
Die heutigen Stromtarife (Hoch- & Niedertarif) entsprechen nicht mehr den auf dem Strommarkt gehandelten Preisen
Die Lastgangkurven auf Bezügerseite werden mit der Verfügbarkeit von PV, Batteriespeichern und SmartHome Installationen nach und nach verändert.
Durch den Mismatch der Preisanreize für Endkunden und EVUs können für EVUs erhebliche Gewinneinbussen entstehen.
Über Mittag wird der Strompreis im internationelen Handel aufgrund der Produktion der Photovoltaikanlagen stark sinken
Unsere APP soll den EVUs aufzeigen, wie diese Einbussen durch Anpassung der Anreize vermieden werden können
Lösungsansatz
Unsere APP zeigt dem EVU auf, wie es den Lastgang seiner Stromkunden zu seinen Gunsten verbessern kann. Anhand realer Referenz-Lastgänge und Strompreisen wird das neue Strommarkt-Design analysiert sowie untersucht, welche Parameter eine Anpassung des Lastgangs bewirken. Basierend auf diesen Erkenntnissen wird gemeinsam mit dem EVU eine neue Strategie entwickelt, welche die langfristige Zukunft der EVU sicherstellt. Dank der Optimierung der Strompreise gegenüber dem Endkunden, beispielweise mit dynamischen Strompreise, kann das EVU aktiv die Umgestaltung bewältigen und gleichzeitig die Energiewende voranbringen.
Mit unserem umfassenden Branchenkenntnis unterstützen unsere Projektleiter und Developer die EVU's dabei, wie auch im Zeitalter des erneuerbaren Strommarktes die Unternehmenszukunft mit aktiver Mitgestaltung und neuen Geschäftsmodellen gesichert ist.
Team
Unser Team besteht aus 2 Energie-Consultants, einem langjährigen Energie-Dienstleister und drei Web-APP Entwicklern:
Thomas Strösslin , APP Unternehmensberatung AG
Pascal Städeli, Linkedin
Marco Pertegato
Julian Schmuckli
Nils Egger
Leon Wink
Vorgehen
Als Referenz-Lastgangkurve werden Daten aus dem Projekt VEiN aufbereitet
Die Strompreise aus EPEX Spot werden gemittelt und normiert, um die stündlichen Preise eines Referenztages zu erhalten
Als Preissignal wird ein gewichtetes Mittel zwischen EPEX Spot Preis und Hoch- & Niedertarif berechnet.
Die Fähigkeit des Kunden, seinen Lastgang zu optimieren, wird anhand von 2 Parametern (Flexibilität Verbraucher sowie installierte Batterie) modelliert.
Der Lastgang wird mit Hilfe des normierten Preissignals optimiert
Daten
Strompreise an der intraday Strombörse EPEX Spot
Lastgangkurven aus VEiN
PV Produktionskurve aus eigenem Modell (Standort Zürich, PVSyst)
Business Case















Programme
Vendredi 15 février
- 09:30
Welcome
- 10:00
Presentation of project ideas & challenges
- 11:00
Team building
- 11:30
Collaborative development of project
Samedi 16 février
- 15:00
Final presentation of results
Lire l’annonce d’origine
Les 15 et 16 février, les Energy Data Hackdays auront lieu au Hightech Zentrum Aargau à Brugg. Utilisons les données énergétiques pour améliorer notre compréhension commune de l’énergie et travaillons sur des solutions qui contribuent à accroître l’efficacité énergétique en Suisse.
– Plus d’informations
– Participer
– Programme & lieu
– Pourquoi participer ?
– Idées de projets & ressources
– Et ensuite ?
– Questions fréquentes
– Organisation & sponsors
Plus d’informations
Les entreprises énergétiques disposent de grandes quantités de données qui ne sont que partiellement utilisées, voire pas du tout. Une meilleure utilisation des données inexploitées pour de nouveaux services et analyses est dans l’intérêt de ces entreprises et de leur clientèle. Lors des Energy Data Hackdays, des entreprises énergétiques, des administrations publiques et d’autres organisations liées au secteur de l’énergie mettent des données à disposition pour développer des idées créatives et de premiers prototypes. L’accent est mis sur les thèmes suivants :
– Le réseau énergétique comme interface avec la Smart City/Community (rôle des réseaux intelligents et des smart grids)
– Le rôle du réseau de transport dans la décentralisation de la production
– Comment garantir la sécurité d’approvisionnement avec de plus en plus d’interfaces, des installations de production plus petites et décentralisées et des appareils/ménages/prosommateurs dans le réseau ?
– Convergence des réseaux et utilisation des données en matière de sécurité d’approvisionnement et d’amélioration du service public (la ville comme propriétaire des données et les entreprises de services publics)
– Mise en lien de la planification des réseaux/gestion des actifs et du développement urbain
Selon l’intérêt des participant·e·s (« hackers »), des entreprises fournissant les données ou d’autres institutions, certains résultats des Hackdays seront développés en applications productives.
Participer
Les Energy Data Hackdays sont ouverts à toutes les personnes intéressées qui souhaitent travailler de manière créative avec des données énergétiques en tant que développeuses et développeurs de logiciels, designers, analystes ou porteuses et porteurs d’idées (« ideators »). Tu peux t’inscrire ici.
Afin de planifier correctement la restauration, nous te prions de nous informer au moins 5 jours avant l’événement, d’ici au 10 février, si tu souhaites annuler ton inscription aux Hackdays. Une annulation tardive ou l’absence d’annulation entraînera une participation aux frais de CHF 100.
Si tu fournis des données énergétiques et souhaites devenir partenaire de cet événement, contacte-nous via info@opendata.ch.
Programme & lieu
Vendredi 15 février 2019
09:30 Accueil
10:00 Présentation des idées de projets & des challenges
11:00 Formation des équipes
11:30 Développement collaboratif des projets
Samedi 16 février 2019
15:00 Présentation finale des résultats
Les Hackdays ont lieu au Hightech Zentrum Aargau, Badenerstrasse 13, 5200 Brugg. La restauration est assurée. De plus, pour les participant·e·s qui souhaitent travailler toute la nuit, des canapés et quelques matelas pneumatiques seront à disposition.
Pourquoi participer ?
– Élargis ton réseau avec des contacts variés du monde de l’énergie.
– Travaille avec des personnes partageant tes idées sur un projet qui te tient à cœur.
– Découvre les nouveaux développements du secteur de l’énergie.
– Présente une idée de projet et motive les expert·e·s à la développer avec toi.
– Les résultats des Hackdays restent la propriété des équipes.
– Nous respectons le hackcodeofconduct.org.
Idées de projets & ressources
Tu trouveras ici un aperçu des idées de projets et des challenges déjà soumis. Tu trouveras aussi les nombreux jeux de données énergétiques ouvertes que nous avons libérés, rassemblés et préparés pour les Hackdays.
Et ensuite ?
Nous visons un impact durable et à long terme avec les projets issus des Hackdays. Les organisations partenaires continuent donc volontiers à soutenir et à promouvoir les projets et résultats prometteurs.
Questions fréquentes
Ai-je besoin d’une idée de projet ou d’une équipe pour participer ?
Non, ce n’est pas nécessaire. Au début des Hackdays, différentes idées de projets et challenges seront présentés. Tu peux contribuer à l’idée de projet qui t’inspire le plus.
Les Hackdays sont-ils réservés aux développeuses et développeurs ?
Non, les Hackdays ne s’adressent pas seulement aux développeuses et développeurs, mais aussi aux spécialistes de la visualisation & designers, spécialistes de l’énergie, journalistes, esprits originaux & personnes d’action. Tu peux t’inscrire ici.
Dois-je rester sur place pendant près de 48 heures ?
Non, ce n’est pas nécessaire non plus. L’important est que tu contribues au succès du projet choisi et que tu conviennes avec ton équipe du moment et du lieu où tu travailles.
Que dois-je apporter ?
Le plus important : n’oublie pas ton ordinateur portable. Tu voudras peut-être aussi apporter ton carnet, des stylos et éventuellement un sac de couchage. Nous te fournirons toutefois le matériel de base, comme du papier, des flipcharts, des post-it, de la nourriture et des boissons.
Organisation & sponsoring

Les Energy Data Hackdays sont une initiative de la Zukunftsregion Argovia et de l’association Opendata.ch. L’événement est rendu possible par :
Si tu souhaites soutenir l’événement en tant que fournisseur de données énergétiques ou partenaire, n’hésite pas à nous contacter à info@opendata.ch.


